Interpreting ADX in the I Chart
Updated 01/31/14
Interpreting ADX
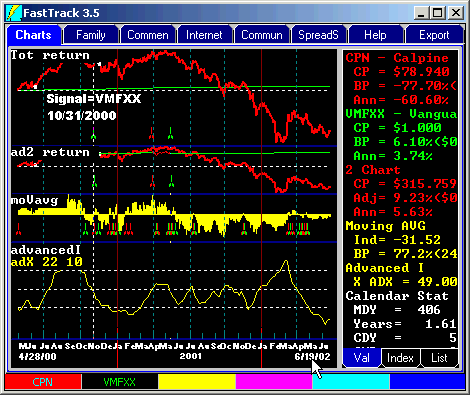
ADX shows the strength of a trend, either uptrend or downtrend. When ADX is above 25 and rising, there is a bull or bear trend, and trend-following indicators can be used appropriately. When ADX is falling, then trend-following indicators are becoming unreliable .The chart shows a 50-day moving average on a volatile stock, Calpine (CPN). Note the substantial number of signals and whipsaws in the V Chart.
 The T chart contains hand entered signals derived
from interpreting the V-Chart and confirming with the ADX I-Chart as follows:
Before 10/31/2000 CPN was in an uptrend. ADX rose to its highest value of 88 (out of 100 max) in September and had begun to declined to a value of 49 dropping below the center dotted white line at 50 on 10/31/2000. This drop below center meant that the uptrend had ended. At the same time the V-Chart had been mostly negative for nearly a month. We hand posted the green sell on 10/31/2000 when ADX confirmed the V Chart's sell.
After the buy, we ignored the red V Chart buy whipsaw which occurred in the context of a plunging ADX. Low ADX values mean that trend-following indicators are unreliable.
High ADX values above the center line at 50 indicate a strong trend in place. The trend may be up or down. The March-April 2002 spike in the yellow ADX line shows the presence of an extreme trend. In this case, the spike marked the end of the downtrend although CPN's new trend was yet undetermined at the end of the chart with very low ADX values.
At the chart end, ADX remained in very negative territory where no V Chart signal would have significance. Low ADX values indicate absence of trend. Trend-following indicators like moving average, Bollinger bands, and AccuTrack will whipsaw unproductively.
The chart shows ADX parameters set a 22 10. The parameter settings are really a subjective matter. If your strategy only makes a trade when the ADX is above 50, then the parameters need to short. if you take signals when ADX is rising, then the parameters maybe longer.