' ' ' ' ' '

FT4Web by Investors FastTrack

Learning about FT4Web | Blog | FLOSS | Who is FT?

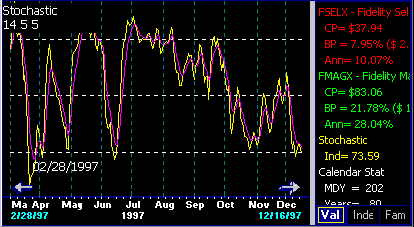
Stochastics Indicator

Updated 01/31/14

Stochastics is a technical indicator developed by George Lane. Its primary application has been in the timing of quick moves in the futures markets.

stochastic.gif (8034 bytes)
 
Stochastics works well when prices are trendless.
  • Stochastics, like all trading-range indicators, is useless when the market is trending.
  • Disclaimer: No technical indicator can assure profits. As market conditions change, the interpretation and use of the indicator must change.

    Stochastics is a technical indicator developed by George Lane. Its primary application has been in the timing of quick moves in the futures markets. This section describes FastTrack's Stochastics in "standard" terms so as to relate FastTrack to other technical analysis texts.

    Mechanics of Stochastics

    Stochastics in futures applications works on the principle that prices close near the top of the trading-range during uptrends and close near the bottom of the range during downtrends. Mutual funds, however, do not have a daily trading-range and they trade in much less volatile patterns. FastTrack offers a multi-day formulation of Slow Stochastics that is appropriate for fund characteristics.

    Interpretation

    Stochastics measures current prices compared to recent prices. Major rallies usually occur from the oversold level (below 20). Major declines usually occur from the overbought level (above 80). Use trend lines or moving averages to confirm trading points. When an uptrend breaks and Stochastics is overbought, then it is time to sell. When a downtrend breaks and Stochastics is oversold, then it is time to buy.

    In the bull markets of the 1990's, it has been virtually impossible for timing indicators to beat buy and hold returns. When a sell occurs with a particular issue, then the cash from the sale should be reinvested issues that have better technical patterns. Thus, knowing when to sell is only part of what an investor needs to know. He must also determine what to buy.

    Traditional Stochastics Terms

    FastTrack Stochastics has three parameters. The first is the range of days over which %K is computed. The second parameter is set to 1 unless using Slow Stochastics. The third parameter is used to smooth %K to reduce the data's point-to-point differences.The Stochastics Chart lines are named:

    %K - The solid yellow line
    %D - The solid purple line

    The abbreviations are sometimes preceded by a number. The abbreviation 14%K stands for %K computed over a 14-day period. The % sign notation is somewhat obnoxious since it denotes a percentage computation. Suffice to say that 14%K has NOTHING to do with multiplication by 0.14.

    The yellow %K line oscillates between 0 and 100 as the price of the fund moves from the bottom to the top of its range. A purple %D trails %K.

    The white dotted lines divide the chart at 20, 50, and 80%. When the yellow %K line is below 20%, the indicator is in the "oversold" condition. When the yellow line is above 80%, the indicator is in the "overbought" condition.

    Parameters

    Stochastics %K
        Number of days over which %K is computed.
    Stochastics Slow
         Number of days over which the Slow parameter is computed.
    Stochastics %D
         Number of days over which %D is computed.

    These parameters can be changed in the Parameter settings dialog box.