Costs of Trading
|
 |
|
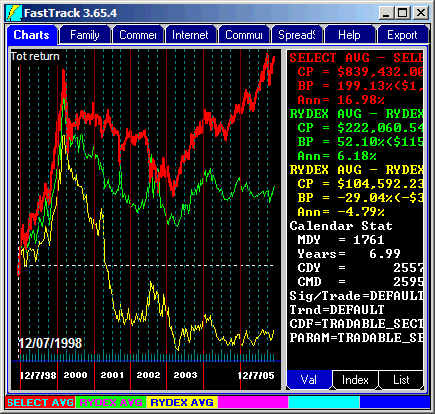
Rydex funds can be traded more often than Selects. However, the FT Momentum Model suggests
that weekly trading (yellow line) of Rydex performs much worse than monthly trading (Green
line). Neither do as well as the monthly traded Selects (red line).
Optimal Trading PeriodIn testing, we have not uncovered a fund trading strategy that performs better with weekly trading compared to monthly trading frequency. On the longer side, quarterly trading often does as well as monthly. Although usually with more volatility. |
 |
|
Not all Exchange Traded Funds are Cheap to Trade |
||
|
ETF's can be a very expensive way to trade .
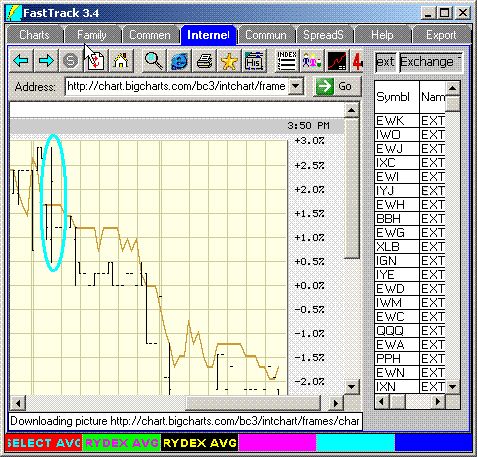
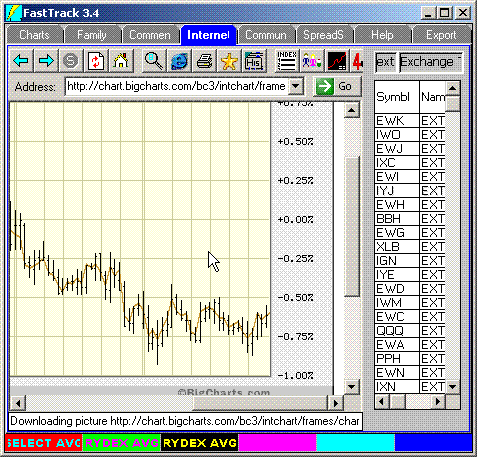
This should display the real-time comparison of IIH and its relevant (underlying) index, YIH-X. Traders must be wary of thinly traded ETFs. The ETF/index spread can be as much as 2-3%. Trading an ETF with a 2% spread is equivalent to paying 2% front-end load + 2% back-end load on an open end fund. Note IIH's trading range (black vertical lines) span 1-3% from the brown line, the ETF's underlying index. As of 11/2003, excessive spread is common for about a third of ETFs. The circled range bar encompasses about a 2.5% range. The ETF./Indeex spread situation has been improving gradually with wider acceptance, and much promotion, of ETFs. Use the trading range chart to review each ETF before considering it for inclusion in a model. |
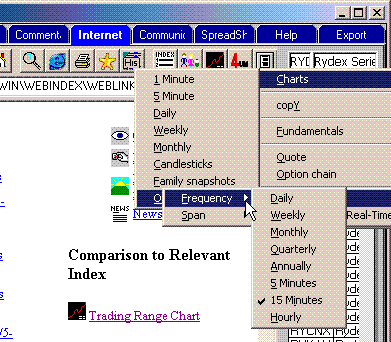
The menu illustration above shows the setup for the Trading Range Chart below.
This trading range chart is available for every ETF and its underlying index. |
|
| This trading range chart is for SPY, the most popular ETF. It is a good example of what you would want in index/etf spread. It never ranges more than 0.1%. |
|
|
