Managing Money with
|
|
Correlation: |
What should I add or remove from my current portfolio to make it better diversified? |
Return: |
What stocks or funds are likely to do well in the coming period (month, quarter)? |
Momentum: |
Is it going up? It's no fun owning the stock that goes down 10% even when the market is down 20%. |
Volatility: |
How can I reduce day-today, month-to-month risks? |
|
|
An Example:
| |
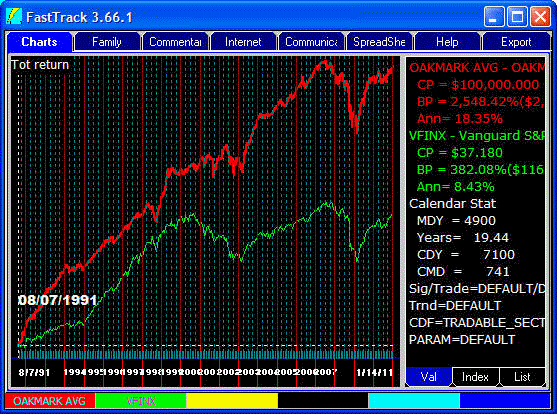
The red line is the result of FTAlpha shifting 25% of assets at the end of every quarter since 1997 among the existing Oakmark funds. This produces a weighted average of the Oakmark funds that is rebalanced. The green line is the Vanguard S&P 500 fund for comparison. The result is a modestly volatile 12.65% annual gain since 1997 for the trading compared to the S&P 500 4.28% annual gain. Oakmark was chosen since it has relatively few funds for this simple example, and the funds are managed in a disciplined manner. They have different objectives and are not highly correlated. |
 |
With a red SD= value of 2.94%, the Oakmark Avg has a Standard Deviation volatility measurement that is almost half the green SD= 5.63% volatility of the S&P 500 fund. Translation: More return with less risk. |
 |
This is a ranking of the period 3/28/05 to 6/27/05 (the day this web page was created). The ranking suggests that as of TODAY assets be allocated to the more conservative Oakmark Equity Income funds and that international small cap positions be reduced. Clearly dividend-adjusted return for the period was a big factor, but not the only factor. Note the Return Column does not exactly agree with the FTAlpha column, although they are close for this particular period. |
 |
This trading log ( a record of how the OAKmark AVG was computed) suggests why the FTAlpha's recommendation is to exit International SmallCap. As of today when the ranking was performed, the portfolio has become nondiversified, AND had begun was losing money from the 3/11/05 top after a long period of gains. The only holdings for the period 3/31/05-6/27/05 were the two International SmallCap funds. |
 |
The yellow line is one of the Oakmark International Small Cap funds. It is easy to see that since 2003, FTAlpha increased the International SmallCap weighting each quarter. As such, today's ranking move back to more diverse allocation is very much called for at this time. While FTAlpha has a strong bias toward diversification. FTAlpha participates in strong, dominating uptrends. |
 |
The Purple line is one of the Oakmark Equity and Income funds. Its easy to see why today's ranking says to move some assets to the purple line. The purple line has a history of return almost as good as the Oakmark AVG with even less volatility. It is apparent from the similarity of the purple and red lines in 1999-2000, that OAKBX has played a major role in the excellent returns of the FTAlpha trading when the green S&P 500 topped. |
 |
Concluding
| |