Interpreting RSI on the I Chart
Updated 01/31/14
Interpreting RSI
RSI is a trading-range momentum indicator developed by Wells Wilder. RSI is also popularly known as Relative Strength Index. FastTrack does not use that term to avoid confusion with FastTrack's Relative Strength, R Chart.
- RSI measures the red line's price momentum. Changing the other lines will not affect the I chart.
- RSI oscillates in a range of 1 to 100. The overbought line is drawn at 70 and the oversold line is drawn at 30.
- RSI, like all trading-range indicators, gives premature signals when the market is trending. RSI signals should be confirmed using trend lines and trend-following indicators.
- RSI and DM+ are identical when the ADX/DM window is set to one and the RSI/adm/dm length is the same.
RSI Parameters
RSI has a single parameter. Wilder recommended 14 days as a parameter. Some books on the subject have suggested that a 22-day parameter may be more accurate. Martin Pring suggests a 9-day RSI for very short movements.
When to use RSI?
RSI is a good sensor of tops and bottoms. It can give signals before price direction changes. RSI major weakness is that signals may be too early . . . they are seldom late.
Use RSI with trend lines to time issues that spurt and the stall, for example, technology mutual funds.
 Interpreting RSI
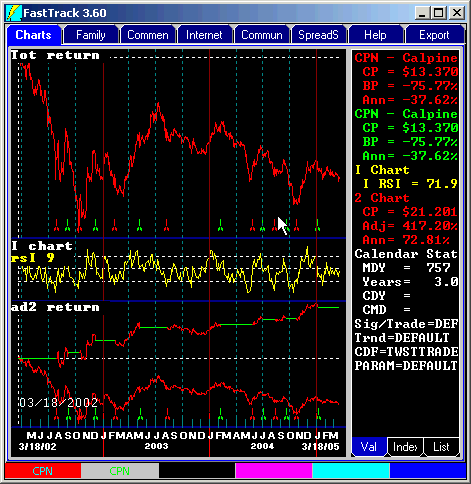
The chart of CPN uses a simple interpretation:
Buy when the yellow RSI line moves into oversold territory and the crosses above
oversold.
Sell when RSI crosses into overbought territory and them moves crosses the center line
moving downward.
This interpretation is appropriate for capturing return during a long-term trendless period. The Buy is quick from oversold levels. The Sell waits for the downtrend to resume.
The RSI line was drawn with parameter set to 9, a relatively short value given the high volatility of this stock.
The signals were hand entered based on visual interpretation. There was a 1-day trading delay in this chart which ensures that the trades could actually have been made as displayed.
Note: There is no "one way" to interpret RSI. While it is used by itself in the discussion above, RSI is often used as a confirming indicator in combination with trend-following indicators.