Signals and Trades - What are they?
Signal and trades are generated automatically by FT4Web's technical indicators, or they may
be entered by hand on the T Chart. Signals generated by indicators show up as red and green tic
marks (red and green dart shapes). Signals entered by hand may be red, green, yellow, purple,
cyan, or blue (the colors of the T Chart's lines. Signals and trades are both visually indicated
by tic marks. They differ in interpretation (discussed below)
|  |
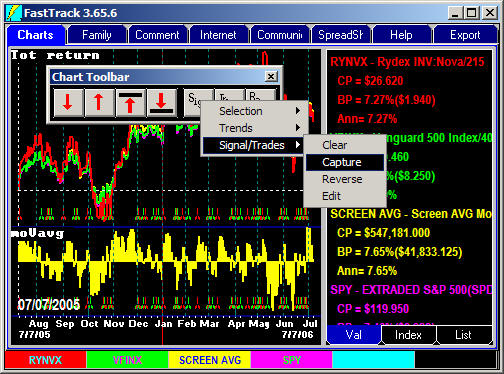
Signals on the T Chart
The T Chart can capture signals from the lowest indicator displayed (not the
signals on the J or 2 Chart) using the Chart toolbar.
Signals are not interpreted or evaluated on the T Chart. Think of signals on the T Chart as
stored signals ready to be applied to a lower 2 or J Chart for evaluation. |
 |
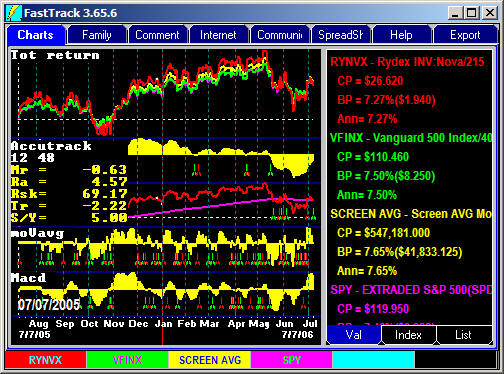
Signals in the Indicators
(A, P, V, and M Charts)
These indicators create signals automatically. The red and green tics show where the indicator changes state. The
Chart Labels values reflect
the evaluation of performance (gains/losses) of the tics as if the trades indicated were made without
delay at the close of the day.
The indicators create only red and green signals, not other colors.
|  |
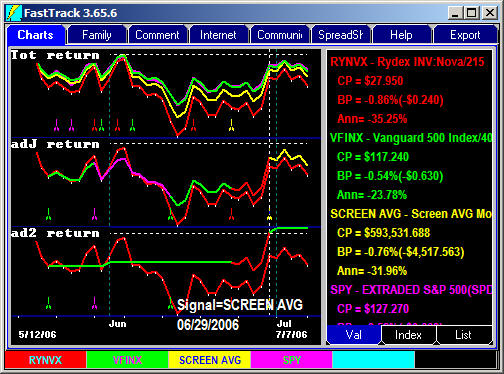
Signals on the J and 2 Charts
J and 2 charts are where signals on the T Chart are interpreted. ote that in
the illustration the signals in the J and 2 Charts are delayed by the Days
Delayed parameter set to 5 Days.
Here the J Chart shows trading among different color lines using a 5-day
trading delay. Note that, of the first six signals on the T Chart, only two (green and
purple) survive and are brought down to the J and 2 Charts. The missing signals
were reversed during the traded delay period.
Also note that the J and 2 chart shift the signals 5 days to the right reflecting the trading
delay. The 2 Chart treats all signals as green, except for the red signals. |
 |
|
FastTrack for the Web defines both "Signals" and "Trades". Trades
holds multi-colored signals indicating trading between multiple colored lines. Signals are limited
to saving
red and green.
Saved Trade files also contain information about the issues which were displayed
when the tics were saved. Loading a Trade file loads the issues in addition to loading tic mark
the trades.
When loading Signals from a file, the
lines on the chart are not changed.
|
Why Use Signals and Trades?
Signals/Trades record the buys and sells you made, or would have made, and show the
results on the J and 2 Charts. FastTrack's indicators generate signals showing the
back tested return of the buys and sells. FastTrack does not optimize its tics. However,
you can vary the parameters yourself to make FastTrack
generate different signals.
In this case a 10-day moving average is applied to a junk bond fund with a 1-day trading
delay.
Click for more on the 2 Chart.
|
 |
To Place Signals or Trades Tics by Hand
You may set tics for either signals or trades using these methods.
- Click the "Sigl" button on the Chart Toolbar. Note
that the button has a pushed in look and that the mouse pointer turns to an up arrow.
- Move to the Dashed Pole to desired signal date.
- Move the mouse pointer below the chart line that you want to buy on this date.
- Click. Be sure that the desired line is above the arrow and that no other intervening
lines appear between the desired line and the top of the arrow. If lines are too closely
drawn, then click above ALL the lines. A color box will appear. Click the desired color.
This will place a colored tic (a buy) for the issue.
When finished placing tics, click the chart Toolbar/Sigl button again. When the T
Chart draws, whatever were the signals or trades last computed are drawn on the T
Chart. These tics can be preserved by right-clicking the Chart Toolbar/Signals/Lock.
- Hint: You may wish to place the T chart below AccuTrack and other indicators so
that the tics saved on the T Chart are the tics used to compute returns in the J and
2 Charts.
You may also wish to use Signals (not Trades) reversed such that a green tic means buy
the red line, and a red tic means buy the green line. Right-click Chart
Toolbar/Signals/Reverse. The appearance of the screen and tics do not change, but
you'll notice the impact on the computation of performance values,
and the J and 2 Charts.
|
To Delete a Particular Signal
- Left-click on the the Sigl button on the chart toolbar to place FastTrack in signal mode.
- Move the Dashed Pole to the date containing the signal to be deleted.
- Press the [Delete] key on your keyboard.
This method will only remove signals from indicators which are not signal generators.
To Save or Load a Signal Set
- Right-click in the Chart Area.
- Click "Save" or "Load" on the Chart Pop-Up
Menu.
- Choose "Signals" from the sub-menu.
- Saving a set of multicolored trades as a signal set will result in the red signals
saving correctly and all other signals converting to green. To preserve all the signal
colors, save as "Trades".
For more details, click here.
|
Text Editing Signals
Signals and trades can be edited as text or in a spreadsheet. Click
for details.
Trades . . . more info
Trades are saved in different file save format than signals. The file name extension is .TRD
A set of trades tics is used in conjunction with the J chart to trade among all the color lines for
which there are trades. The TRD file is an ASCII text file that can easily be edited or
printed. The file format is obvious. Just use a text editor to view any .TRD
file.
Push the Chart Tool/Sigl button to set tics when you click the chart. When tics are set
for more than just the red and green lines, then the tics cannot be saved as a
"Signal" file (*.SIG in the \FT\SIG directory). You must save these as a
"Trades" file (*.TRD in the \FT\FT4WIN\TRADES directory).
You may save tic sets that contain just red and green tics as *.TRD files. HOWEVER,
the tics remember what issue they are set for and will load the issue
automatically. Thereafter, you may change the issue if you wish and, if you save the
trades again, the new issue/trade association will be saved.
To Clear Signals or Trades from the Chart
- Right-click on the Chart Toolbar and choose "Signals/Trades" from the pop-up
menu.
- Choose "Clear" from the sub-menu.
|
On Exiting FT4Web...
FT4Web remembers the name of the signal or trade files currently being displayed. If the
signals/trades have not been saved, then the signals/trades are saved to a file named,
\FT4WIN\SIGNALS\DEFAULT.SIG or \FT4WIN\TRADES\DEFAULT.TRD
On restart, the named file is reloaded or DEFAULT is reloaded.
Warnings:
- DO NOT store your signal/trade files in the C:\FT\FT4WIN\Signals subdirectory itself
since they will then be mixed with FastTrack-defined signal/trade files (ones made by the
FastTrack staff and sent to you) making it difficult to determine the origin of the files
and to understand whether you can delete a particular file later.
- The LOWEST (last drawn) set of signals is saved. For example, If you are displaying TTAAJJ, then edit
the signals on the T Chart, then right-click/save signals, . . . the unedited signal from the A Chart (AccuTrack)
will be saved (not your edited T Chart signals) since AccuTrack is below
the T Chart.
|