FT4Web by Investors FastTrack |
|
|
Diversification
Combining Selection and Diversification
The Rules for Sector Funds
Relative Strength Pairing Strategy
|
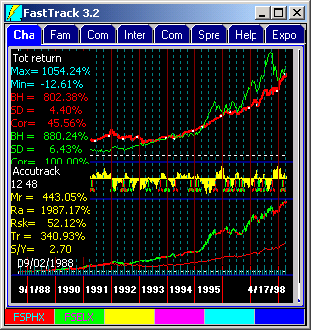
Health vs. HITECHFor FastTrack's entire history the two sectors with the brightest futures have been Health (red line) and HITECH (green line). AccuTrack® was invented to trade these two sectors, and has worked amazing well since inception. This example trades between sector mutual funds.
These sectors have both fundamentals and demographics working in their favor. There is no reason to believe that these sectors will become fundamentally unsound in the near future or that they will become highly correlated. |
 |
|
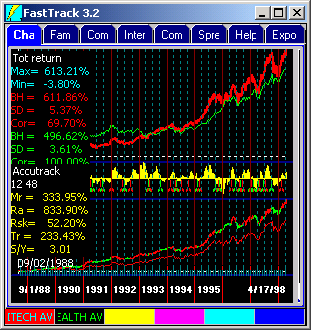
Sector Stocks AveragesAs with the health and HITECH mutual funds, the average of families of high tech stock and health stocks show similar trading characteristics. Further, it is possible to generate signals from the stock AVG and profitably apply these signals to the sector funds or even to individual stocks. |
 |
|
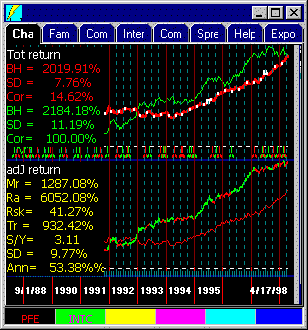
Stock to Stock Using AVG SignalsThis chart uses the signals generated by the stock averages above to trade Pfizer (HEALTH) and Intel (HITECH). The stocks could have been traded using AccuTrack® between them, but the signals from the averages work better with fewer trades. This doesn't always work. Be sure to pick stocks whose correlation with the averages used to make the signals is at least 50%. If the correlation is less, then trade the stocks against each other directly instead of using signals from the averages. Of course, in a bear market it is always possible for both issue to plunge. This is where timing or modeling using many different issues enters the picture. Use trend lines . When both of the issues are trendless (moving sideways) don't trade or find a different set of issues to follow. |
 |
|
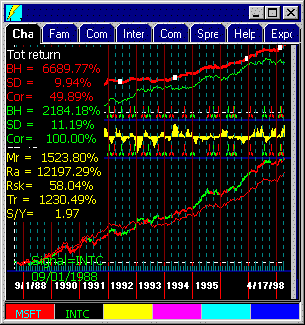
Same Sector TradingWith mutual funds, trading between sector funds in the same sector rarely produces exciting results. However, stocks in broad sectors can have low correlation and be tradable. The example shows Microsoft vs. Intel trading directly. Two trades per/year would have produced outstanding returns. Of course, in a bear market it is always possible for both issue to plunge. This is where timing or modeling using many different issues enters the picture.
|
 |
|
Energy vs. TransportationEnergy and transportation sector funds trade well. They tend to move in opposite directions although imperfectly. When energy gets expensive, airlines and trucking have higher costs and become less profitable.
Of course, in a bear market it is always possible for both issue to plunge. This is where timing or modeling using many different issues enters the picture. |
||
Energy vs. GrowthMost growth funds will trade well against energy and many other types of funds. Energy follows a beat of a different drummer. Weather, technology, international tensions, OPEC mandates, and currency fluctuations have a complex effect on the profitability of companies in the energy and energy services industries. There are some whipsaw periods that create unprofitable trades. Use trend lineconfirmation to filter out those excess trades. Of course, in a bear market it is always possible for both issue to plunge. This is where timing or modeling using many different issues enters the picture. |
||
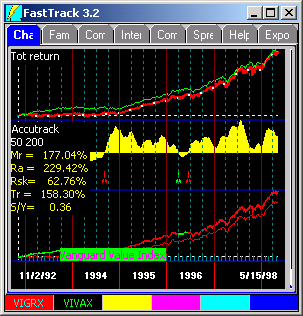
Growth vs. ValueThis strategy was originally published in FastTrack commentary in1993. It remains largely unchanged although updated on 3/2/96. The strategy switches between growth and value mutual funds depending on the long-term shifts in sentiment of the market. Sentiment DefinedGROWTH funds hold promise for greater revenue, and profits. VALUE funds promise appreciation of assets, improved profitability, and gains from special one-time situations. When GROWTH stocks reach new highs, investor interest often shifts to VALUE stocks in search of issues that are not so far extended. When GROWTH funds are out of favor, the stock market typically underperforms its historical averages. However, during these periods VALUE AND CYCLICAL funds may do quite well. What Funds to Use?Unfortunately, it is hard to pick good VALUE funds. Many VALUE fund managers have abandoned their "value" objective in recent years to improve their performance. We suggest three pairs of Growth/Value funds you might want to trade.
|
|
|
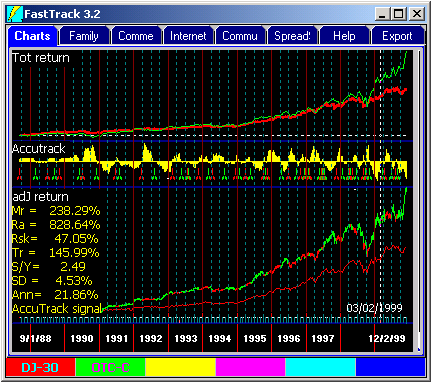
Small Cap to Large Cap Using the J ChartThe J Chart is most commonly used for selection . . picking between two issues The screen shot above shows using AccuTrack® to signal switches based on the strength of the NASDAQ Composite (OTC-C) and the Dow 30 Industrials (DJ-30). You cannot invest in the Dow or the NASDAQ Indices directly, but these signals are appropriate for switching between funds in the CAP-SMALL and CAP-BIG families which include funds that invest in small cap and large cap issues, respectively. These signals may be saved and then used to trade between any two large cap/small cap funds . . . or you may trade the funds against each other directly using AccuTrack®. This strategy is the most appealing and most easily implemented of FastTrack's strategies. It involved the two largest identifiable segments of the market. There are many funds and many pairs to choose from. This strategy deserves to be part of every investors portfolio. Of course, in a bear market it is always possible for both issue to plunge. This is where timing or modeling using many different issues enters the picture. |
 |
|
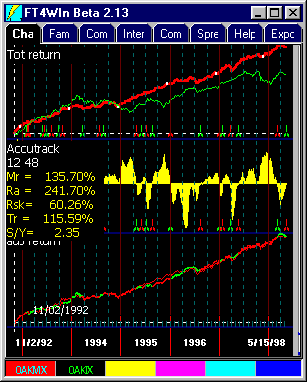
Domestic vs. InternationalMany advisers suggest a 60/40 allocation of US Domestic investments and International investments. We agree, but implement it differently. Pair a good US fund with a good International fund. Trade between them according to AccuTrack®. The chart to the right shows Rsk=60.26%. This is the time spent in red line, OAKMX, a domestic fund. The other 40% of the time was spent in the green line, OAKIX, and international fund. The result is a return about the same as the better of the two funds, OAKIX. Although the J Chart's red/green Composite was invested 40% internationally, there was no net penalty. This strategy give you sensible trading points between two very large investment options. Of course, in a bear market it is always possible for both issue to plunge. This is where timing or modeling using many different issues enters the picture. |
 |

 Allocation of