Updated
09/29/14
People do a Lot with Charts

Saving a Chart
Chart saving saves every FastTrack for the Web setting that you currently
see.
Specifically,
- The chart contents, colors, sizes, indicators, period, signals, trend lines ,
fonts, and more.
- Export settings including export definitions, family exported, options chosen.
- Spreadsheet columns used.
- Families loaded on the Chart Tab and Export Tab (but not the Internet or Spreadsheet
Tab.
- Printer settings including printer used, chart size, colors, and text displayed.
- Signal and trade file names.
- Parameter files.
When a chart is saved and then restored, every aspect of the chart is
restored . |
 Load and Save Options Load and Save Options
- Click on the Chart Tab.
- Right-click in the chart itself.
- Choose Save/Load and then choose Chart.
Selecting this menu option opens the standard Windows "open
file" dialog box. Choose the CHARTDEF file you want to load/save chart
When the chart is reloaded, all the currently displayed issues, signals, time span, etc. will be replaced by those saved with the
chart. The original chart size, fonts, indicators displayed, etc. will be
set as they
were saved. |
|
CHARTDEF files may have any valid name. They
may be saved anywhere, but we suggest
C:\FT\FT4WIN\CHARTDEF\USERDEF.
DO NOT store your charts in the
CHARTDEF subdirectory itself since they will then be
mixed with FastTrack-defined charts making it difficult to determine the origin of the
saved file and to understand whether you can delete the file later. For commentary and other
purposes, FastTrack will download CHARTDEF files with your regular daily data update.
These WILL overwrite you own CHARTDEF files of the same name if you place your CHARTDEF
files in the \CHARTDEF folder instead of the \CHARTDEF\USERDEF folder.
Chart Date Options
This options pops up after saving the chart definition. The choice governs the date
range displayed when the previously saved chart is redisplayed. Type a single character
into the input box and hit the <Enter> key.
- E - The start date remains the same and the end date is set to the current end date of
the database. The chart gets longer and longer.
- S- The number of market days displayed remains constant. The end date is the last date
in the database. The start date equals the end date minus the number of market days of the
constant span.
- F -Fixed: The start and end dates never change.
If you want to change an option, just load an existing CHARTDEF and the resave using a
new option. The default option value is S for a new CHARTDEF, and is whatever was
previously set as the option when saving over an old CHARTDEF.
|
Why would you want to save your charts?
You may want to review the same view of an issue you hold in your portfolio every
evening with exactly the same trend lines , colors, etc. Also, you might wish to print it
every evening and you will find that the Chart definition includes the printing options
you select.
Alternately, you may prefer to have a standard view for mutual funds in the GROWTH
family, a different view for stocks in the DJ-30 Family, and yet another view for
bond funds in the BD-EMERGE family. A loaded CHARTDEF restores the family loaded, the indicators
shown, time span, custom colors, etc.
Note: The original chart cannot always be restored when
- The family have been changed and has missing or new members.
- An issue has been removed from the database.
- The parameter set has changed. The parameter set named,"DEFAULT" is saved every time
FT4Web shuts down. To avoid surprises, save the current parameters under a name of
your choice, then save the chart . . . the saved chart definition will contain the saved
parameter name, not "DEFAULT"
|
Sending a Chart by EMail or including it in a Word
Document
You can send a CDF file as discussed in saving and loading. However, the
recipient must have FT4Web. Also you must also end separate parameter, FNU, and
other files that will be needed, and the recipient of the email must have
must place this off of the files in the right FT folders.
A better bet is to send the actual Chart from FT. Here are the steps.
- Size the chart appropriately for an email. This can be done
manually resizing the FT4Web window, or by right-clicking the chart and
selecting Appearance, then setting the Chart Size to Small or Normal.
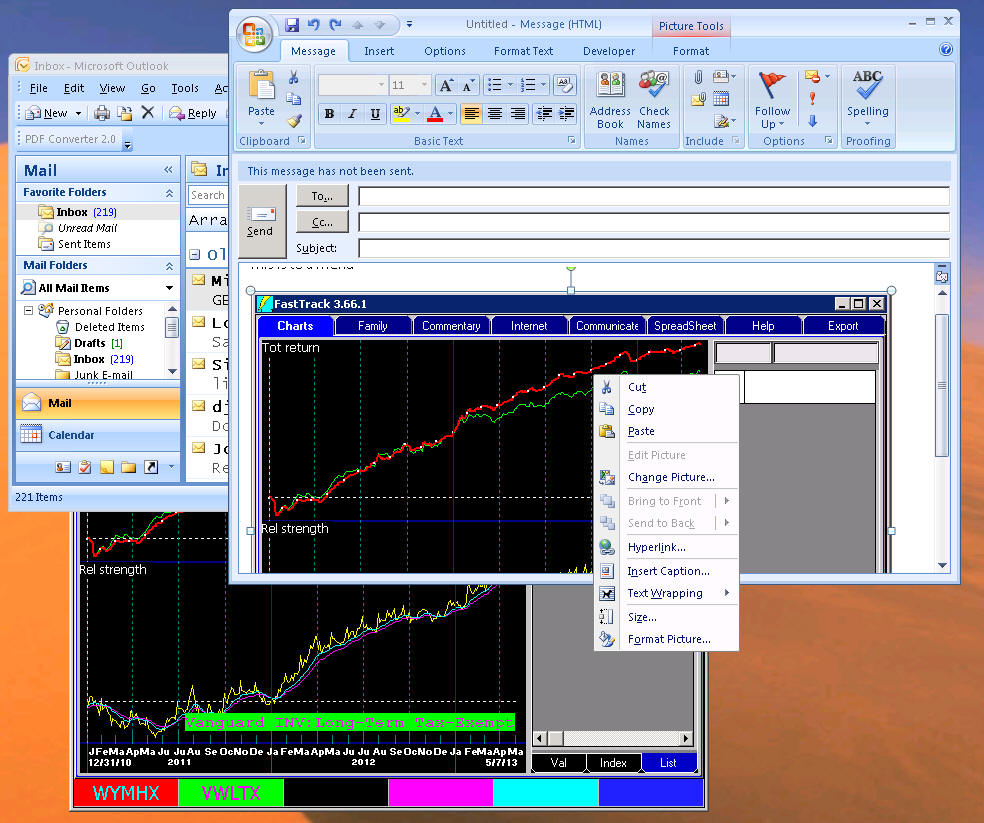
- With your cursor resting on the chart, Hold down the <Alt> key and hit
the <Print Screen> key. This places the chart image on the Window Clipboard.
- In your email, paste the clipboard chart into the email. Often you
right-click and select "Paste" to accomplish this task. It depends on your
EMail package. In the example below we use Outlook Express 2007 running
under Windows XP.
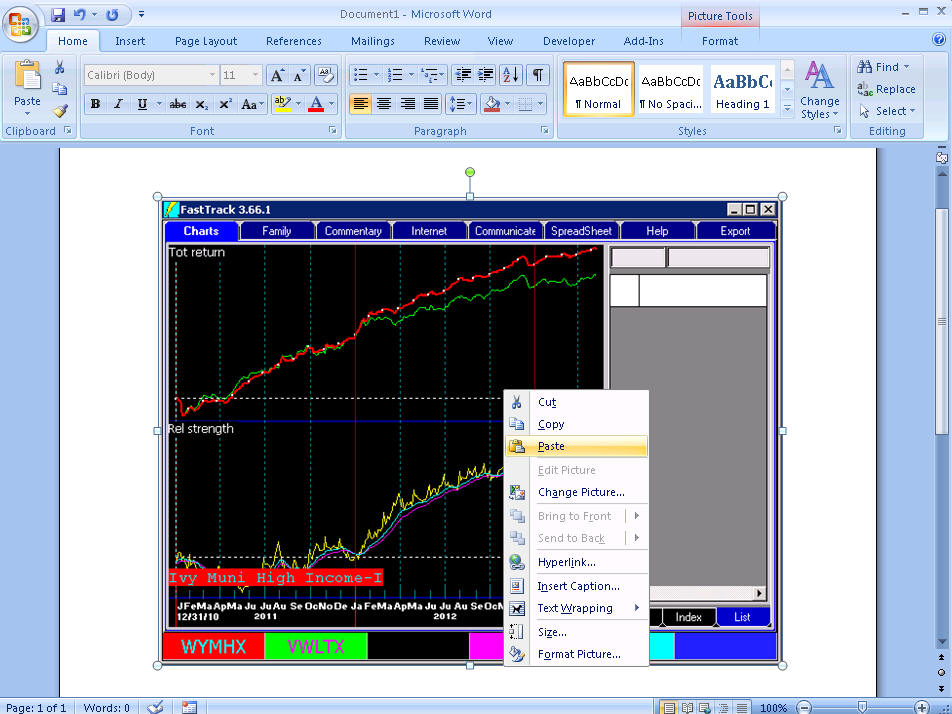
Exactly the same technique is used with Microsoft Word. Right-click on your
document and paste after doing Steps 1 and two above.
|