Interpreting Directional Movement Indicators on the I Chart
Updated 01/31/14
 RSI and +DM
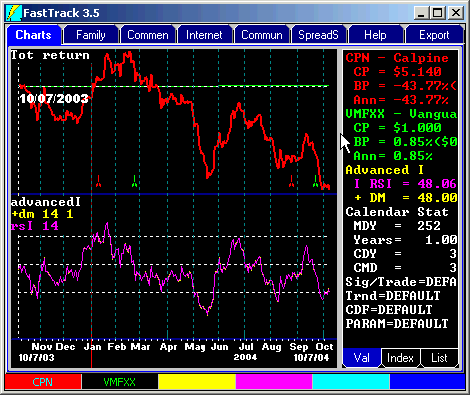
With the Window parameter set to 1, +DM is nearly identical to RSI..
Increasing the Window size for +DM reduces the volatility of RSI and may produce a line that is easier to interpret.
 Interpreting DM
In Wilder's "New Concepts in Technical Trading Systems", his primary interpretation of Directional Movement is a simple cross over of +DM and -DM.
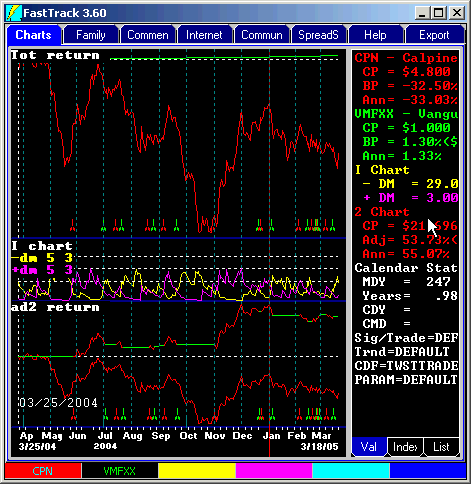
We have placed buy/sell red/green tics on the dates where the yellow and purple +DM and -DM cross.
The timing converts a -32% annualized return to a positive 55% return.
For mutual funds with modest volatility, a concept worth exploring is using AccuTrack to create trades between the +DM and -DM lines. See the discussion about moving yellow lines to the T Chart for detailed analysis.
Like most technical indicators, DM always reduces risk which always improves performance in bear markets. However, return is reduced in bull markets.