Risk-Adjusted ReturnUpdated 05/14/14
This is true for most mutual funds, but less applicable to stocks, Well managed funds have more return than expected. Poor funds take too much risk to get their return. Risk-adjusted return requires that you establish the context
|
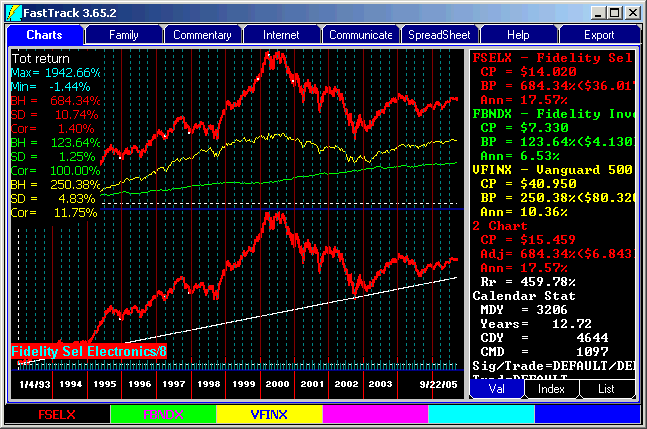
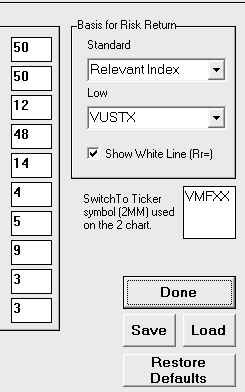
Predicting return using the White LineThe chart shows a yellow S&P-500 fund, VFINX. For this chart, VFINX is selected as the "Standard Risk Basis" for all US Equity funds. The green line, FBNDX, allocates assets across different bond market sectors and maturities. For this chart, FBNDX was selected as the "Low Risk Basis". This selection establishes the ratio of risk to return. RR= Formula: RR = 35.40 X (FSELX SD - FBNDX SD)
+ FBNDX Return Given the VFINX/FBNDX context, the white line in the 2 Chart in the lower half of the screen shows the expected return of FSELX . Since the red line, FSELX, is more volatile than VFINX, it should have more return, and indeed it does. The long term gain of the red line bumps along the white line.
|
|
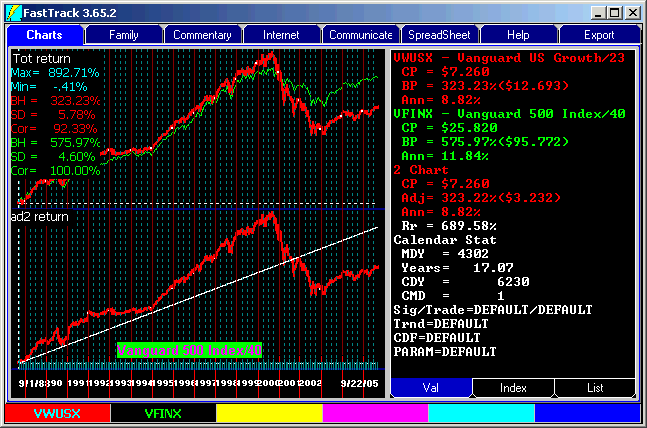
VWUSX, an actively managed fund, has a higher SD= than VFINX, yet lower returns. This fund has poor
risk-adjusted return shown by its falling below the white line.
If the red line has an SD that higher is than Standard Risk issue's SD or lower than the Low Risk issue's SD, then the white line cannot be computed and an error message appears. The white line will be displayed as a flat line. |
Judging Dissimilar Funds
|
Mutual Fund Risk and ReturnThe chart shows a scatter diagram of risk (Standard Deviation, X-axis) and return (Y-axis). Key benchmarks are highlighted. The points are for the Fidelity funds that existed for the period 9/1/88 - 5/1/98. The risk/return of the S&P 500 (actually we used the SD and return of VFINX) falls in the middle of the spectrum. A short-term bond fund like FSHBX falls at the conservative end. A technology sector fund like FSELX falls at the aggressive end. We drew a red line using linear regression through the points. Funds above the line would be considered to have "good" risk-adjusted return. Funds below the line have "bad" risk-adjusted return. |
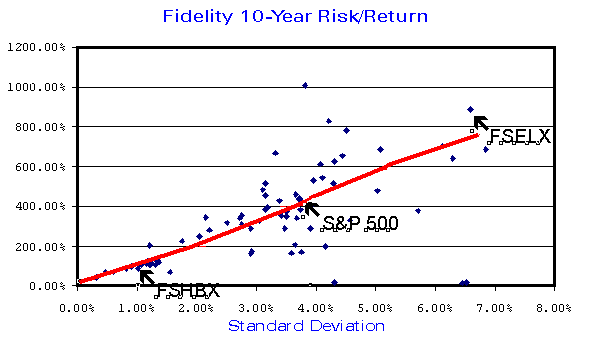 Note that points fall along a line drawn between the risk and return of FSHBX (a short-term bond funds) and the SP& 500 (Actually VFINX). FastTrack's J and 2 Chart white lines are drawn based, by default, on these two points. However, for international funds, sector funds, and other funds that do not correlate highly with the S&P 500, the white line would be inappropriate unless you change the issues that define the end points of the line. See parameter setting. FSHBX defines the "Low Risk Basis" for many of FastTrack's calculations while VFINX define the "Standard Risk Basis" for calculations. |
Stock Risk and ReturnThe chart shows a scatter diagram of risk (Standard Deviation) on the X-axis and return (Y-axis). Key benchmarks are highlighted. The points are for the FastTrack stocks family ALL-NYSE that existed for the period 9/1/88-5/1/98. The diagram has more points, and the SD and returns span a greater range. You don't see the extreme ranges in funds because funds average the performance of many stocks. The red Mutual Funds risk/return regression line illustrates the risk-adjusted appeal of mutual funds. Funds are less volatile, yet offer good returns for the considering risk. |
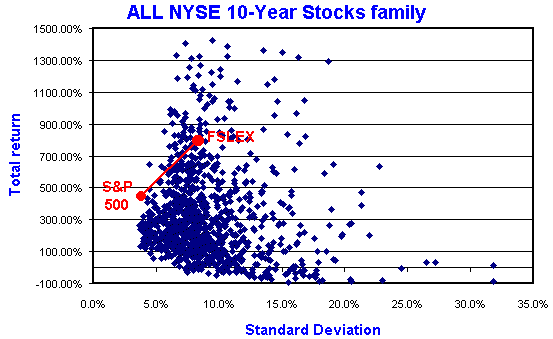 It is MUCH harder to pick a good risk/return performer in stocks than in mutual funds. Mutual fund's appeal to the typical investor because the chances of getting burned are much less. However, it you can pick a few hot stocks, then the potential for return is much higher with stocks. In this case, defining "Low Risk Basis" using VFINX and "Standard Risk Basis" as FSELX is not appropriate. Indeed, there is really isn't any appropriate basis for assessing risk vs. return for the all NYSE stocks. Note that many NYSE stocks are relatively low risk, low return preferred and convertible stocks which need a different basis for risk and return than regular common stocks. |
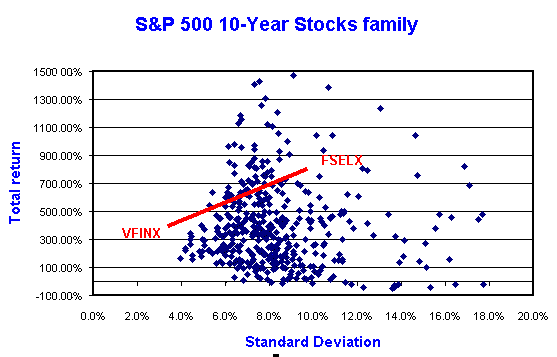
S&P 500 Stocks, as subset of all stocks.For the decade of the 1990's, the large companies of the S&P 500 haven't been as volatile as the broader family, NYSE stocks (chart above). Now the risk/return line defined by VFINX and FSELX is more appropriate, but still a bit high. While it is unlikely that the S&P 500 stocks will continue this advantage, it is likely that you will do better owning with issues that have a FastTrack Standard Deviation under 10% . . . remember that return prediction at risk extremes of is impossible. Beyond an SD=10.0%, DO NOT BUY and HOLD. Volatile stocks should be considered speculative investments that must be actively managed. Take profits and cut losses regularly. |
 |
 If
you want to find out whether any given fund has good management, compute the fund's expected
risk-adjusted return and compare its actual return Over the long-term,