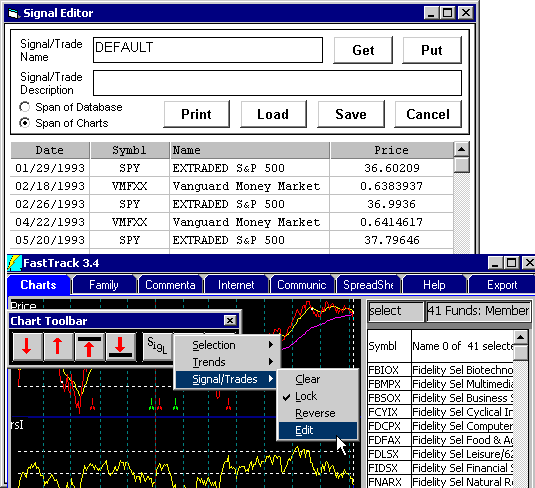
Signal Editor
Updated
01/31/14
The signal editor provides a method to enter signals directly using the keyboard
instead of the mouse or indicators. You may also change existing signal sets.
- There is a simple editor for
Buy/Sell trading (between two issues)
- There is a more complex editor (see
next line below) for FT Trades (trading amongst more than two funds)
 Start the Signal Editor
(more complex) Start the Signal Editor
(more complex)
Right-click on the Chart Toolbar. Select Signal/Trades then Edit.
- The lowest signals on the chart will be loaded.
-or-
- Use Load button to load an existing signal set from a saved disk
file.
-or-
- If you have no signals on your chart, then just put up a V Chart
that has signals, then edit the signals from that point.
Note: You cannot create a "new" set of signals
unless you first load an existing set first.
Changing Contents: Click on a cell and type changes to its contents.
You can change a date or a symbol.
Deleting Lines: Highlight cells with click and shift-clicks (standard
Windows mouse techniques) and hit the DEL key.
Inserting Lines: Highlight a cell below the desired insertion point
then right-click and choose "Insert Signal". (This
doesn't work when there are NO lines displayed). A blank line will be placed above
the insertion point. Type the date and ticker symbol as appropriate. Dates DO NOT have to
be entered in Order. See Sorting below.
Sorting: Click the Date or Symbol label at the top of each column.
This will sort the column. Each click alternates between ascending and descending order.
Get Button: Loads the columns with signals from the lowest set of
signals on the charts.
Put Button: Places the signals as edited onto the T or P Chart. Also,
sets the Signal Lock feature.
Save Button: Saves the signals/ trades as edited in a named signal/
trade file. When there are only two symbols used in a set, then the saving is done as a
SIG file by default in C:\FT\FT4WIN\SIG\USERDEF. When there are 3 to 6 ticker
symbols in a set, then saving is done to a TRD file by default in the
C:\FT\FT4WIN\TRADE\USERDEF
Hide Button: Makes the signal editor seem to disappear, but does not
unload it from memory (like clicking the X close box would do). This means that the next
time you start the signal editor, the columns will contain exactly the same data as when
you clicked the Hide Button. This is similar to clicking the - Minimize button (top right)
except that Minimize places a tab on the task bar. Price Column:
This column is the dividend adjusted price at which the signal is given.
Note: After a dividend, all previous prices are adjusted. This means it is
possible to have the same saved signal display different prices a few days
later. This will not affect return calculations, but can be confusing. The
price column is useful in confirming price levels at which trades are
made, however, it is not save with the signal.
It is called NotePad . . . a simple text editor built into Windows. We
are going to assume you know how to use NotePad . . .
if not then click here. What you do is to build a file that looks like
this "314MyName"
S,10/07/2005
B,10/20/2005
S,05/18/2006
B,06/30/2006
... as many lines as you want. Where
- "314 indicates that this is a signal file
MYName" is the name of the signal file that you assign.
- S,date is the date of a SELL (Green tic)
- B,Date is a red BUY tic
When done editing, then save in
C:\FT\Sig\ as MyName.Sig
All the loading instructions given above apply.
|