FT4Web by Investors FastTrack |
AccuTrack IndicatorAccuTrack is a trend-following indicator. When the red line's price momentum changes relative to the green line's price momentum, AccuTrack gives a signal. |
|
|
Disclaimer: No technical indicator can assure profits. As market conditions change, the interpretation and use of the indicator must change. |
AccuTrack Shows Relative StrengthAccuTrack shows the relative performance of the red and green lines. This means AccuTrack can be negative when other indicators are positive. This can occur when the red line is gaining value, but not performing as well as the green line. Other technical indicators may be positive just because the red line is gaining. Only the AccuTrack indicator suggests that a climbing mutual fund may not be a good selection because it is not keeping up with the other alternative expressed by the green line. |
How AccuTrack is DrawnWhen AccuTrack is positive and rising (bars increasing in height above zero with time), the red line is showing more strength than the green line and is likely to continue to do so for some time. The converse applies when AccuTrack is negative and falling. There are times when AccuTrack is neutral. These periods have no bars. Generally, you neither buy nor sell in neutral periods. The chart may have up to 6 sections at the same time. This chart shows three sections. Sections are stacked vertically with dates aligned. See Controlling the Charts. The top chart is the T Chart . . . T is for Total return. The center part is an indicator, AccuTrack. It tells when to be in the red mutual fund and when to be in the green mutual fund. The lowest chart is an adJusted return chart, the J Chart. The J Chart shows the impact of switching an investment between the red and green lines. |
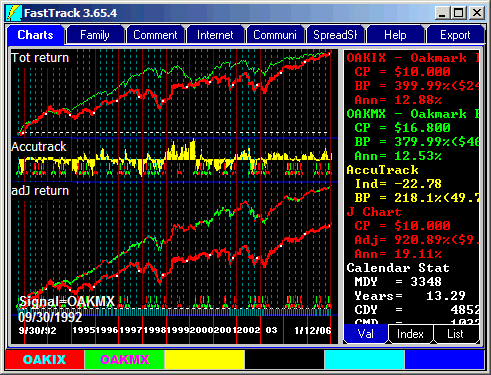 The Red and Green Tic Marks on AccuTrackThese mark the days on which the AccuTrack says TRADE. You see the tic on your computer screen at the extreme rightmost position of the indicator on the day that the signal occurs (circled above). The tic color tells which issue should be bought. There is no sell tic as in FastTrack for DOS. The advantage of being in the right mutual fund is apparent. The chart above suggests that there is a time to have assets abroad in Oakmark International (OAKIX), and a time to bring them home in Oakmark Growth (OAKMX). The Red/Green composite line of the J Chart shows return nearly as high as the better of the two funds, yet you have been diversified by owning international for a significant portion of the time. Always review your strategies with your traditional sources of investment advice. |
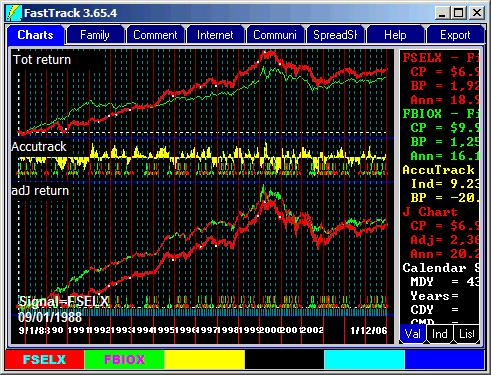
Classic FastTrack Strategy for trading mutual fundsIn the beginning, FastTrack strategies were entirely composed to trading between pairs of the Fidelity Select funds. This work welled for the first 10 years of usage but ran into trouble in the 2000-2002 bear market. This strategy highlights the power of momentum trading as well a the foolishness of lack of diversity. |
 |
|
Once the final bottom of the bear market was reached. The trading strategy resumed its high return
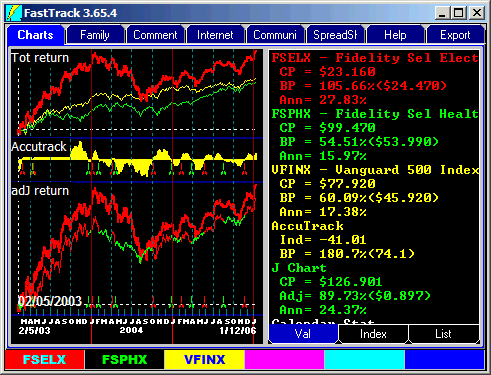
with modest risk. AccuTrack is best used to trade between mutual funds whose patterns are not well-correlated. In the case above we used international and domestic, but more commonly FastTrackers like to trade sector funds, for example, HITECH funds and HEALTH funds. Note: This chart uses FSPHX, as less volatile health fund, that FBIOX above. |
 |
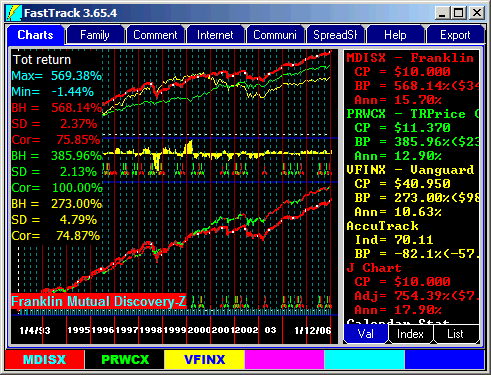
AccuTrack with Broad Based HoldingsFor actively managed funds, their success depends on the investing philosophies of their managers. Successful managers have long runs during which their strategies are in favor. This chart shows two managements which have been successful through both bull and bear markets . . . but their management has different philosophies. Illustrated by the relatively low correlation ( of 73.52% |
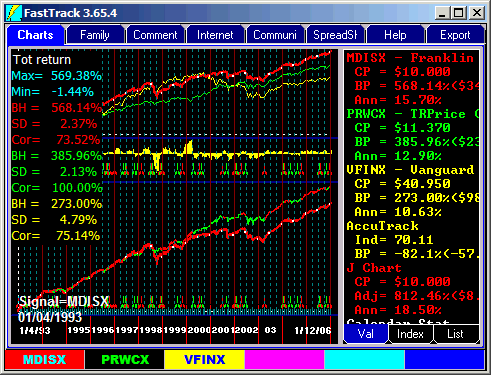 A good fund manager could have a Relative Strength trend that continues up in a market downturn . . . even if his fund goes down. Of course, it would be ideal to not be invested in any mutual fund during bear markets, however, that implies that you can be a successful market timer, a difficult feat. FastTrack investing techniques emphasize being in the right investment based on relative strength. Trading to the strongest issue is much easier than market timing. |
AccuTrack is Ideal for Indecisive InvestorsTry varying the number of trading days delay. What you will see is that, when AccuTrack gives a trading signal, you need not trade instantly. Increasing the trading delay has only modest impact on AccuTrack profitability. Note: This chart differs from the no-delay chart above in that this chart has a 10-day trading delay from signal to execution. |
 The 10-day delayed trade produces an annualized return of Ann=17.9%. This is slightly lower than the no-delay return in the chart above above of 18.5% . Using the delay also reduces the number of trades per year on the average to 1.2 instead of 2.1 without the delay (whipsaws during the 10-day delay are ignored) |
|
| |
