Last changed 05/10/99
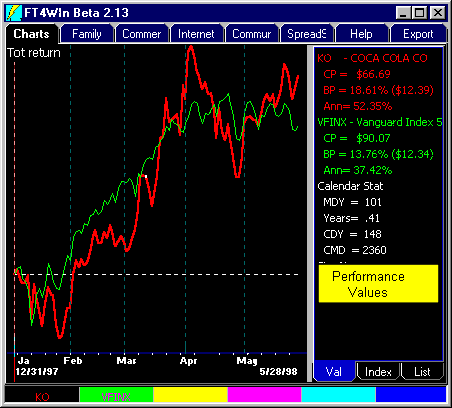
The T Chart Shows Price Change and Total Return
Total return is not the same thing as price change. Total return takes into consideration:
- The reinvestment of cash dividends to buy more shares.
- The reinvestment of capital gains to buy more shares.
- The value of rights offerings (usually closed-end funds).
- The value of distribution of shares of stock in another company. For example, the value of Lucent shares paid to AT&T shareholders in October of 1996. When companies spin off or merge, our data shows the return to a shareholder of the original issue if he liquidated newly distributed shares and simultaneously bought after-distribution shares denoted by the original ticker symbol.
Price Changes and other Statistics are Found in the Performance Values
The Total Return Chart shows 1 to 6 lines. Each line is color-coordinated with performance values. The white performance value are "Calendar Statistics" telling you the number of market days, calendar years, etc. displayed.
