Contrary Strategies
Updated 06/16/14
This is a relative strength trading strategy of some complexity. The premise is that two stocks in the same industry will trend in the same direction long term, yet may move quite independently over short periods of several days. Hence, a stock which falls behind in short-term return should catch up over the longer-term.
How to find such Pairs
This is a set of rules that you can vary as you please. There is no magic to the numbers we give. In our example, below, we picked NBR and PKD. These two companies are involved in oil and gas exploration.
- Load a family of stocks in the same industry.
- Find two stocks whose correlation of 1-3 day price direction is quite low . . . less than 40.
- Work using in the Parameters Setting Dialog to see if the 5-10 day correlation of price change is greater than 50. If short-price direction correlation is substantially less than long price change correlation, then we have found an ideal pair.
- Display TTAJJJ.
- Set AccuTrack parameters quite short . . . 5 and 8 in our example.
- Set the Trading Delay to a small positive number 0-5. In our example, Trading Delay is set to 0.
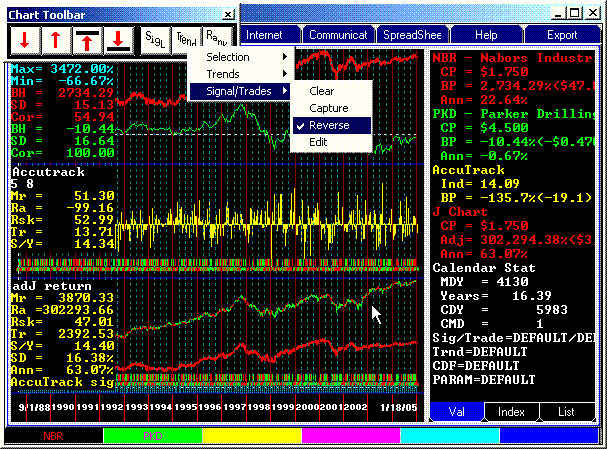
What you should see is a large number of trades of AccuTrack which work quite poorly in the J chart. AccuTrack actually tells us exactly the wrong time to trade. This suggests that our premise is correct. Jumping from a short-term loser to a short-term leader in the same industry is a disaster.
7. Right-click the chart tools and set Signals/Reverse
 What you should see now is a reversal of the J Chart. In this case, with 14 trades/year
over 16 years, the result is a respectable 63% annualized return.
Trading costs were negligible . . . 100 trades X $8.00/trade at Fidelity= $800. If you had invested $1000 and paid the trading fees, you would have $30,294 at the end of 10 years.
But That's a lot of trades!!
Nope, it works out just a little more than a trade/month.
What's the Catch?
First, you have to be able to make trades at at the closing price after you see the signal. That may not always be possible. On the other hand, it may be possible to buy at even a lower price than yesterday. The example shown above uses after hours trading (0 trade delay). However, the results are still quite good with a one-day trading delay. Your trading success will certainly be better when you trade large, blue chip issues which trade in significant volume after hours.
Second, you don't want to be doing this when the most recent year has a correlation much over 60%
Third, consider timing your holdings with a 200 day moving average and a 10-day trading delay should both issues take a dive.
Finally, NO, this is not a diversified approach to sensible investing. This example illustrates a correlation technique that bears considerable risk.
Value Investing
This strategy seems to work well with most everything. That true because most everything has a tendency to lag and spurt spurts. A laggard compared to a winner tends to catch up.