Correlation Strategies
Updated
06/16/14
This sections discusses how to use correlation in trading strategies.
Correlation is a measurement of the strength of the relationship between the mutual fund and
the index (red and green lines of the T Chart). Correlation measures the extent to which
the movements of the issues are similar. FastTrack's correlation is computed according to an algorithm published in
"Biometry", Robert Sokal and F. James Rohlf, W.H. Freeman, 1969, Page 509.
Click to learn how to
|
 |
High Correlation
Strategies
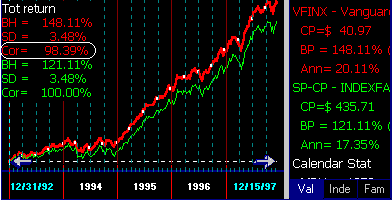
For example,
- Vanguard Index Trust 500(VFINX), green
- Vanguard Total market Index (VTSMX), red
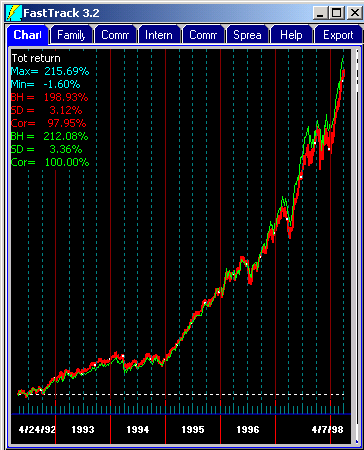
If Cor= is 1.0, then the red and green lines have perfect correlation. In this
case the correlation is 98%, very high. Both these index funds from Vanguard are mostly
the S&P 500 stocks.
No Point Short-term Trading
When mutual funds are highly correlated and have about the same historical total returns,
there is no point trying to devise short-term switching strategies. There is not enough
differential in the short-term mutual fund movements to make a difference.
But they can be traded long-term. Use AccuTrack with long
parameter settings (like 25 100) to trade between high Cor= growth funds. This will pick
up slight differences with very few trades per year . . . Think of this strategy as a
safety check. If one of the mutual fund managers begins doing deviating, then the indicator will
take you to the better issue.
|
 |
Low Correlation Strategies
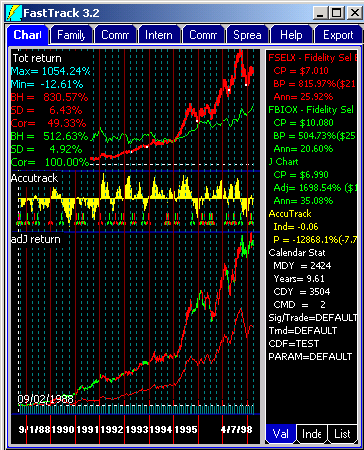
These two sector funds are affect by different governmental regulations, population
demographics, technology developments, and investor sentiments.
The correlation is a low 56%, You can expect to have trading opportunities between
these sectors.
The AccuTrack indicator shows where to trade between the mutual funds to get the J Chart's
red/green composite return of 35%/year . . . Much better than either of the two funds
alone.
This same type of trading can be done between stocks. Time the sector rotation using averages of stock sectors or indices and apply the
timing signals to individual issues in each sector.
|
|
Negative Correlation - the Perfect Pair
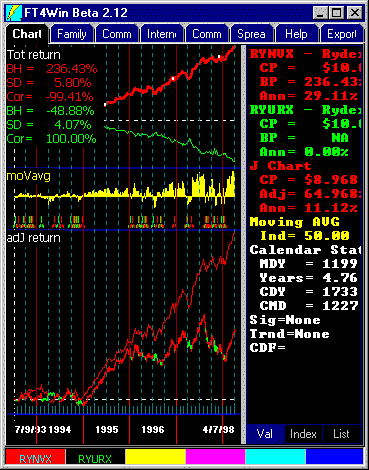
If Cor= has the value of -1.0, then the fund and index are perfectly negatively
correlated. The best examples of negative correlation in the database are two Rydex mutual funds
(Rydex Nova RYNVX and Rydex Ursa RYURX). These mutual funds are intended by the manager to run a
highly negative Cor=. They are designed for professional market timers, and not the
average investor.
How Could I Lose with These Mutual Funds!
Not only can you lose, you can lose big time. It is guaranteed that when one mutual fund is up
the other is down. You will be depending on pure market timing.
This is NOT a strategy where you can use FastTrack tools to pick the better mutual fund. When
we recommend switching between mutual fund pairs, it is always involves two funds with good
long-term fundamentals.
But Isn't This AccuTrack Heaven?
NO! AccuTrack does well picking the stronger of two independent mutual funds, but we are only
dealing with ONE set of data for these Rydex funds . . . Nova always runs with the S&P
500 and Ursa always runs against it. AccuTrack has no advantage over moving averages in
this situation.
In fact, AccuTrack will not compute signals when two issues are too closely correlated.
In such cases, AccuTrack would do no better than a moving average.
|
|
Other Negatively Correlated Pairs
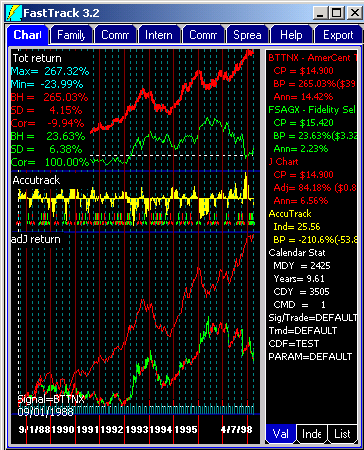
Some of the stronger negative correlations over the past 10 years include pair
ZERO-COUPON bond funds with gold funds: BTTNX vs. XAU-I. Strength in gold stocks often is
accompanied by weakness in the bond markets as both react to inflation speculation.
However, profits from trading to gold funds are difficult to achieve. The opposite
movement between gold and bond funds often does not occur in trends that are long enough
to trade using mutual funds.
The J Chart portrays a lot of switching whose net result in a sad, sub-5% annualized
return. You will always find trading between sectors with good fundamentals for gains more
satisfactory that trying to hedge against losses.
There are Contrary Strategies that use AccuTrack
in reverse.
|
 |
Energy vs. Transportation
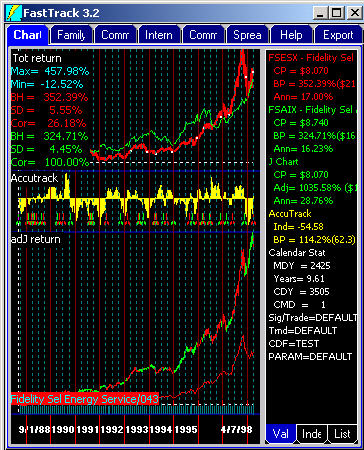
One of the better examples of low correlation trading includes FSESX vs. FSAIX. Not
only do these mutual funds have low correlation, but also there have been long periods where they
actually have negative correlation.
Both sectors respond to energy prices. Fidelity Select Energy Services (FSESX) does
well when energy prices rise. Fidelity Sel Air Transportation (FSAIX) does well when
energy prices fall . . . fuel cost is a big factor in profit margin.
|
 |
The Spreadsheet Tab has an optional correlation column which compares all the issues in
a list to the green line.
- Click on the Spreadsheet Tab.
- Load a set of issues into the Issue List
- Be sure the issue for which you want to find a trading partner is in the green cell of
the ColorBar.
- Add the Cor column.
- Compute the results.
- Sort the Cor column in order.
The issues with the lower correlations have a better chance of being a trading partner
to the green line. WARNING: Long term dogs have low correlations to winners. Just
because Gold funds have a low correlation with the a green line winner, don't expect
pairing to work. Pair two winners with low correlation. not a winner and a loser.
Wait! My Chart Has Different Numbers
Not all numbers on this page will match what you see on your display. See the Weird Numbers section on the Mathematical Computations page.
Correlation vs Covariance
FastTrack's Correlation value is commonly referred to as the Correlation
Coefficient. The first step in a Correlation calculation is to compute
covariance. FastTrack's Correlation is the covariance divided by the product
of the Standard Deviations.
Why correlation instead of covariance? Because:
Correlation will give you an easy to interpret value between -100 and +
100. Correlation is the unitless version of covariance: it is
covariance translated into a standardized measure, from -1.0 (perfect
negative correlation) to 1.0 (perfectly correlated). Whereas, Covariance is
the linear relationship expressed in situation-specific units; correlation
is the same but without units.
|


