 Distributions,
Dividends Distributions,
Dividends
When They Send You the Profits!
Updated
06/26/17
Where are Distributions found within FastTrack?
All types of distributions (general term for dividends, splits, capital
gains, etc.) change the total return of an issue.
Distributions are put on the T and P Chart as white dots on the red line. The
white dot for splits is bigger. When you
move the Dashed Pole to a white dot, the distributions
descriptions
popup . You can right-click on that label to temporarily disable the distribution popup if
you don't care about dividend details.
FastTrack's Spreadsheet will also list
distribution totals. Tax Spreadsheet. will compute
the gains/losses you should report on your tax returns.
What Is a Distribution?
Distribution is a general term applied to several different types of
transactions.
C - LT CapGains
Long-term Capital Gains: The most common form of capital gains is distribution of
cash from a mutual fund who sold appreciated assets held more than a year by the mutual fund. You
may also have capital gains paid to common stock share holders.
L - Super LT CapGains
These distributions were created by the tax reduction of 2001 for assets
purchased after 1/1/2001 and held more than 5 years. There is a quirk in the
act which allow conversion of assets bought before 1/1/2001 to use the new
reduced tax rate by paying the old rate on pre 1/1/2001 gains and then the
new rate on subsequent gains. Therefore, mutual funds that converted may have Super
LT CapGains well before 1/1/2006.
D - Income
Dividends are the most common form of distribution. Dividends are the payment of money to
share or bond holders. Usually dividends are taxable as ordinary income except dividends
from a municipal bond fund, but consult your tax adviser for details As of
1/1/2003, this includes "Qualified Dividend" which are taxed at lower rates
under the 2003 tax reform bill. We continue evaluating the inclusion of
these dividends as a specific category.
G - ST CapGain
Short-term capital gains: These are capital gains from assets held less than a year. In 1998,
Congress, in its collective wisdom, instituted other holding periods which greatly
confuses the capital gains treatment. FastTrack
contains only short and long dividend characterizations.
I - Split Dollar Amount
Most of these distributions are for mutual fund splits. They are carried as a dollar value
rather than a split ratio. This category is probably unnecessary, but is used within
FastTrack for DOS which does not offer the split ratio handling.
Z - Split Ratio
These distributions are shown as a ratio based on the closing price of the underlying
stocks. Splits are common with stocks, but also found in a few mutual fund histories.
S - Stock Div
Used for certain types of complicated transactions. FastTrack carries the value of share
splits as a dollar amount value. For example the AT&T spin-off of Lucent, we
calculated the closing price of Lucent shares on the first day they could have been sold
by an AT&T shareholder and reinvested those proceeds in AT&T shares at the closing
price on the same day.
Most of these transactions are special cases which have to be hand-worked, Our figures for
total return MAY not agree with other published figures. We are interested in any
feedback on these issues. When you call us, please be prepared to cite the source, amounts, and
dates of the figures you have obtained that are different from FastTrack's. Also, if your
nonFastTrack numbers are the result of a computation, please provide the formula the other
source is using. We will investigate our own data and formula's even if you cannot provide all
the listed information, but may be unable to explain differences.
R - Return of Cap
The return of capital from liquidations of mutual funds of common stocks. This is a rare
type of distribution.
U - Current Gain
This type of distribution is usually associated with an international mutual fund.
T - Rights
This is the offering by a mutual fund or stock company to sell current shareholders discounted
securities issued by the company. These rights often have a real value that expires over
time. DO NOT ignore a right offering as you will likely lose investment value. Consult
your financial adviser for more details.
O - Other
Distributions that do not fit characterizations above.
Ending
Shares - Assuming that you start with one share, these are the number of
shares reinvested. FastTrack always starts with one share on the first day.
Projected Dividends - These are dividends that have been
announced for future dividends but are not issued yet. They are subject to
change. When dividends are distributed ,they could be different amounts and
on different dates.
|
FT4Web Charts are Adjusted for Reinvestment and Splits
Almost all distributions affect the total return of your investment. FT4Web always reinvests
distributions in more shares of the same issue effectively changing the number of shares that you
own.
On the FT4Web chart, return computations are always based on a single share at the close of the
first day displayed. When a distributions occurs, then FT4Web reinvests the dividend at the close on
the X-Date. This mirrors the most common practice for funds and for stocks with DRIP (Dividend
Reinvestment Plan). The FT4Web return will hold true even if the "Pay Date" for the distribution is
later than the X-Date. When the reinvestment occurs , on a date later than the X-Date or at a price
other than the X-Date closing price, then FT4Web's total return will differ.
In summary, the FastTrack database contains all distribution information per share. Your brokerage statements and
the dividends reported at each white dot will agree on the distribution amounts.
But I think your adjustment method is wrong. How'd you do it?
Print the Distribution Adjustment Work Sheet.
This document shows how FT4Web does the calculation.
Comparison to Value Line
The section below is reproduced from the 3/6/98 issue of Value Line reports. Note the
"Div'd Decl's" enlarged section. Compare that to IBM on your FastTrack screen.
|
 |
Unlike FastTrack, Value Line reports historical distributions as split-adjusted values.
The Value Line totals for a period will agree with FastTrack's totals for the same period
WHEN the period ends AFTER the last distribution or the period includes a split. The
totals will NOT agree when the period ends before a split. Value Line's distribution
information WILL NOT agree with your brokerage statements, whereas FastTrack's information
will agree.
The individual distribution values reported by Value Line will agree with
FastTrack's individual distribution values if there has been no split AFTER the
distribution. When there has been a 2-for-1 split, for example, then FastTrack
distribution values BEFORE the split will be double the Value Line reported values. In this
case, FastTrack's values will agree with your brokerage statements, Value Line's
will not agree. FT4Web's computations are fully disclosed in the
FTDIS.CSV
file.
Distributions can Affect Price strongly, but have Slight Impact on Total
Return
Most distributions are cash removed from the portfolio and paid to you.
After the distribution, each share is no longer worth as much. The price of
shares decreases by the distribution amount. The decrease occurs on the
"X-Dividend Date" designated by the issuer of the share at the market close
for the x-day. Usually this is the within a very few days that the issue
pays the distribution to you.
A few mutual funds may hold distributions in their own account for more
than a couple of days before paying you on a "Pay
Date". This causes a problem. The fund price reflects the removal of
the distribution from the x-date closing price, but there is no reinvestment
in new shares or cash payments in your brokerage account. Yet, FastTrack
will show the redistribution of those dividends. In fact, FastTrack's Total
Return will be a best guess at the actual value of your holding, but it
won't agree with the low figure what your brokerage reports to you.
Eventually, you will collect the dividend paid on the x-date even if you
sell the shares before the Pay-Date, and at that point FastTrack and your
brokerage will show total return that is almost the same. Although the
distribution X-amount is removed from your brokerage account, it is still
invested in much the same way as your portfolio and as such the net impact
on your total return on the Pay Date is usually very small.
Generally, the delay in Pay-Date serves to smooth the process of
rebalancing a portfolio. Assets are traded in an orderly manner with buys
and sells netting out evenly with a pad of the unpaid distribution
masking some volatility.
Distribution Totals & Yield Calculation
The Distribution summary is displayed when the Dashed Pole is moved to
the last day of the chart. The numbers are accurate for the period of the chart's width. When
there have been several distributions during the period, the computations for deriving totals
and yields are quite complex. The computations are fully disclosed in the
FTDIS.CSV
file.
Note: Distributions on the very first day of the chart are NOT
included in the return and yield computations for the rest of the period. Distributions are
applied at the close of market and included in the period when the
distribution x-date is the last date of the period measured.
Note: FT4Web's are fully disclosed in the
FTDIS.CSV
file.
Chart Total - Distribution Summaries
When the Dashed Pole rests on the last date of the chart, then FastTrack computes a
summary of distributions. This display can be disabled by right clicking on the
chart and unchecking the Div Info Show menu item.
One Year Yield= The yield of the most recent one year period. This
calculation treats income dividends as distributed (they send you a check) instead of reinvested.
This is the same as the spreadsheet Yield1Y amount. Click
here for or more discussion.
Income reinvested= Total cash distributions for the period displayed. The
calculation treats income distributions as reinvested, hence, there are more shares over
time and the distribution compounds. This means that Income reinvested= is, always,
somewhat higher than the raw sum of the distributions over the period. This amount is
equivalent to the amount on which you would pay taxes as it is the sum of income
distributions when such distributions are reinvested.
Note: FastTrack allows reinvestment in fractional shares. This is always possible with
mutual funds, but seldom possible for stocks. Therefore for stocks, the FT reported
Income Reinvested= may be slightly higher than reality.
Short + Long CapGains Reinvest= - Total of short + Long term
capital gains for
the period displayed. The total considers that each distribution is
reinvested in additional shares. The amount shown should be deducted
from assets before paying taxes when the shares are finally sold. You will have already paid
taxes on this amount.
Unrealized CapGains: The amount of capital gains that
would occur for one share bought at the beginning of the chart if sold on
the last day of the chart.
- Show Tax SpreadSheet: Clicking this
menu item produces a detailed, itemized list of distributions suitable for
calculating tax liability. The output is a file named,
C:\FT\FT4WIN\TEMP\TAX.CSV
FT4Web will attempt to open this file invoking whatever program
(usually a spreadsheet program like Microsoft Excel.) you have selected to
handle CSV files. From your spreadsheet program, you will be able to view
and customize the tax spread sheet calculation for your purposes.
Wall Street's Dirty Little Distribution Secret
 We hate to be the bearer of
bad news. Wall Street has little secrets that can really mess up your return. We hate to be the bearer of
bad news. Wall Street has little secrets that can really mess up your return.
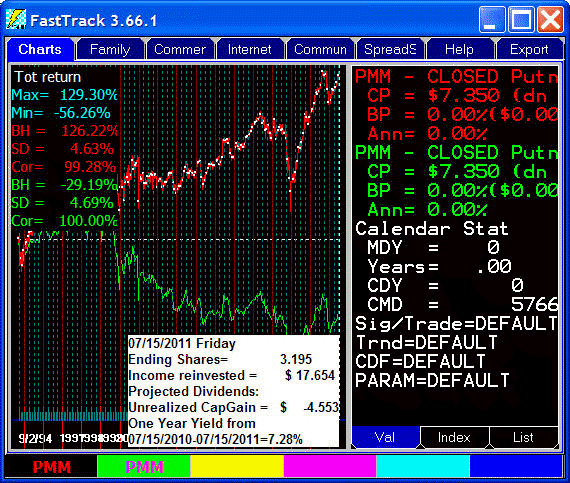
This Closed End Putnam fund shows that it has a 7.28% yield (income
dividends). This happens to be a Municipal bond fund, but there are many similar
funds which are taxable.
- Unfortunately, a lot of that yield has come from simply handing
back your initial capital investment as dividends. Note that the
green line (your capital
value) continually drops. They are giving back your initial investment as a
dividend artificially inflating the yield.
- If PMM were held in a taxable account (of course, modify these comments
for this municipal bond fund), you end up paying taxes again on money
that has already been taxed once. Note that the
green line is the same
red PMM fund, but with the
FT4Web "ignore Dividends" option selected.
- FT4Web reinvests distributions the closing price on the X-Date. But if
you have asked your broker to reinvested dividends automatically, then you
may not get the save price as used by FT4Web(and other sources).
- Watch out! If everyone automatically reinvests at the market
"open" price on the same day, the open price may spike up making the
automatic reinvestment at a very unfavorable price.
In general, you should NOT reinvest dividends paid by stocks and open end
funds automatically. Have the dividends go to cash and use that cash as part of
your regular rebalancing plan. Also . . . examine the reasons you own a fund
like this carefully. NEVER hold it in a taxable account. This DOES NOT apply to
company sponsored DRIP plans for which the company issues new shares, or
provides shares from a source (its own holdings) that are not acquired through
market trading on the X-Date. See details of your DRIP program.
Final comment: Note that FT shows a capital loss of $4.553 per share. This
capital loss may NOT be fully deductible, costing you a sizable (relative to the
dividends) loss of income. We are not tax experts . . . check with your own
financial consultant as to how this affects you.
|