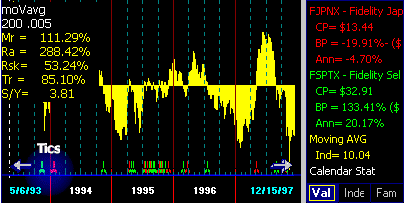
Moving Average Chart
Updated 05/13/99
Moving Average (MA) is a trend-following indicator. When price direction trend changes, MA changes.
-
MA works well when the red line is in a strong uptrend or a downtrend.
- MA, like all trend-following indicators, is useless when the red line moves sideways trendlessly.
Disclaimer: No technical indicator can assure profits. As market conditions change, the interpretation and use of the indicator must change.
Exponential Averages Used
All moving averages used in FastTrack are exponential averages of the adjusted closing price. The indicator is plotted as a series of vertical lines. When more than 1.5 years is displayed, then these vertical lines visually merge into a solid form. The height and direction of the lines is the difference between the issue's price and its moving average. When the price is higher than its moving average, the indicator bars are above the centerline. When the price is lower than its moving average, the indicator bars are below the centerline.
Buy and Sell Tics
Buy tics occur when the moving average's distribution-adjusted closing price becomes lower than the issue's distribution-adjusted closing price. This causes the bars to switch above the centerline. Sell tics occur when the moving average's distribution-adjusted closing price becomes greater than the issue's distribution-adjusted closing price. This causes the bars to drop below the centerline.
Parameters
The moving average (V indicator) has two parameters which can be changed in the Parameter settings. The first parameter is the length of the average. Longer moving averages are good at judging long-term trends of equity funds. Short moving averages are good for judging trends in certain types of funds with good day-to-day serial correlation like BD-JUNK and REALTY family funds.
The second parameter has three modes of operation.
- If the second parameter is less than 1, then it is used as a filter. A filter reduces
the number of signals especially during trendless periods.
The difference between the fund and its average must exceed the value of the filter before
a signal will be given. Signals occur where the red line moves above or below the average
by the specified percentage. Filter values between .001 - .1 are useful. Filter values
between .1 - .99 (10% - 100%) have no practical value and may produce strange results.
A filter value of .005 means that the V chart does NOT give a signal until the difference between the moving average and the red line is more than 0.5%. This frequently happens and is useful in removing whipsaws during trendless periods. On the other hand, a filter value of 0.1 means that the V Chart signals when the difference is more than 10% . . . this seldom happens . . . and when it does the move has been so traumatic that the indicator is useless.
- If the second parameter is set to 1, then NO smoothing and NO filtering is performed.
During trendless periods, the switches are counter-productive. Signals occur where the red
line crosses it moving average. However, with volatile mutual funds this technique has
some merit. Stocks are, generally, too volatile for profitable use of moving averages.
- When the second parameter is greater than 1, then that value is used as a second moving
average by which the 1st moving average is smoothed. Signals occur where the red line and the
moving average cross. This will reduce whipsaws during trending periods, but
is of little value during trendless periods This is mathematically equivalent to the crossing of
the yellow and purple averages in the P Chart.
- The histogram is produced by displaying a bar which is the difference between the red line and the double smoothed average.
Yellow Values
The Moving Average chart's yellow value is set in a range between 100+ and -100. When the moving average is lower than 0, then the V chart has yellow bars below the center. When the moving average is higher than the 0, then the bars are above the centerline. This reported value is different when compared to FastTrack for DOS. It is reporting the relative difference between the moving average and its reference line (which may be the red line or an average of the red line).
Hitting the ! key (exclamation mark) moves the yellow values to the red line. In FT4DOS, this function produced a smoothed moving average line. In FT4WEB this line is the actual V chart histogram values ranging from 100+ to 100-. To get a smoothed moving average line do ! when the P Chart is showing.
Coordination with the P Chart
The V and P charts produce the same signals in cases (2) and (3) above. Signals generated by the P and V Chart should be identical and the resulting Mr=, Ra=, Rsk=, etc. performance values should be the same.
 What does this
mean to me?
Moving averages are best suited for finding the end of a long, strong trend. Once the end has been found then, STOP using trend-following indicators and start using trading-range indicators. For more detail, see the discussion of timing indicators.