FT4Web by Investors FastTrack |
Beta
|
|
|
|
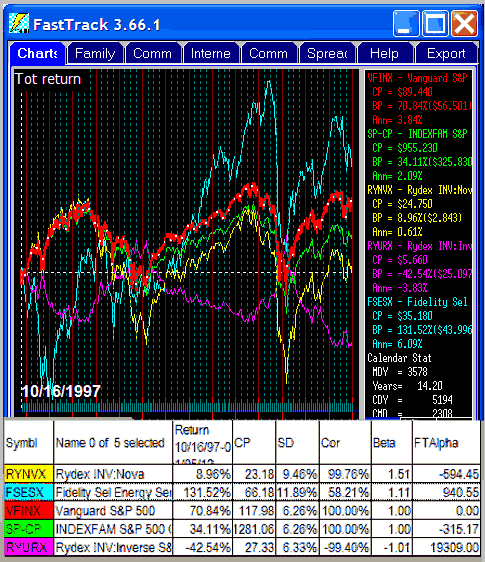
FastTrack FTAlpha - Related to BetaThe chart above includes a column for FTAlpha. FTAlpha is a function of correlation, downside volatility, and return. FTAlpha is easier to interpret than Beta when looking for diversification. In this case the basis for FTAlpha is VFINX. Note the FTAlpha score of 0. This means that buying more VFINX will not change the risk or return of the current basis holdings of VFINX Note that FSESX has the highest FTAlpha value indicating that it is the best bet for diversification when combined with SP-CP. The risk/reward ratio would improve both by increased return and reduced risk. The portfolio would have an SD= that is less than the average of the two issues' SD=, and a return that is greater than the average of the two returns. Also note, that FTAlpha's second choice is VFINX . . . while this paring would not affect risk, it would boost return. VFINX gains 2% more annually thus improving the risk/reward ratio. RYURX has a negative FTAlpha. Do pair VFINX and RYURX. While volatility would be greatly reduced, return would be very low. |
|
|
|
|
|
Click to see Morningstar's Principia Beta calculation in PDF form.There is a significant difference in the FT and MS calculation. They subtract a Treasury constant from each of their monthly returns before calculating. This is introduces a linear adjustment in the a calculation that produces a nonlinear result. Also, the concept of return without risk embodied in this calculation fell apart in the 2008 financial crisis making the MS beta values indeterminate based on estimated T-Bill returns. There are many different equations for computing Beta. here are some of the significant differences between MS and FT.
Finally, the correlation of these funds is pretty low to the S&P 500. As correlation drops 95%, Beta becomes a useless figure with low correlation offsetting volatility. The interpretation of a Beta of 1.5 (meaning 1.5 x performance of the S&P) is always suspicious. Compare the performance of VFINX (beta 1.0) to RYNVX o( 1.5) over any multi-year period. Consider using the Ulcer Performance Index for the fund relative risk/return instead of Beta. It has the distinct advantage of measuring only downside volatility. |

 Highly Correlated Beta
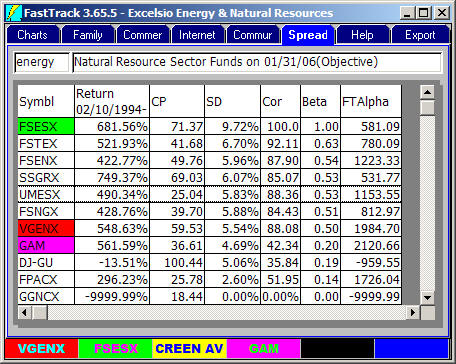 Using Flexible Beta
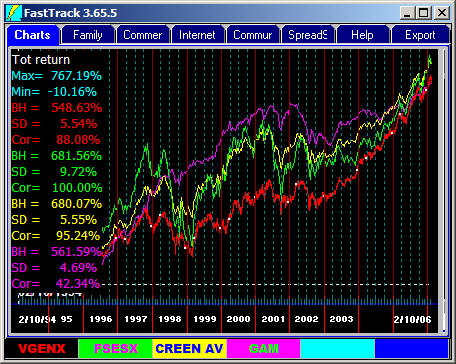 Picking the Best Energy Fund
 |