RSI, ADX, DM Indicators on the I Chart
Updated 01/31/14
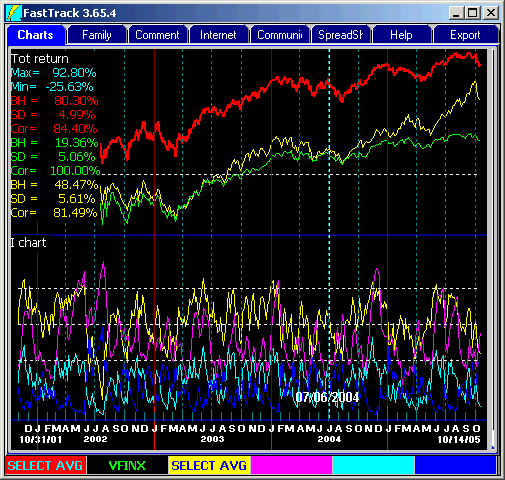
 The appearance of
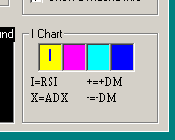
this chart is controlled from the right, lower corner of the Appearance
Dialog.

The I Chart may contain 1 to 4 lines of different colors. Click to select one of the color squares, then type the corresponding letter for each type of indicator line.
The values of the ADX and DM are controlled by their internal average lengths found in the Parameters Dialog.
