Timing Strategies
Updated 09/29/14
Fundamental + Timing Strategy: Buy and Hold
Buy-and-hold is a timing strategy whose rules are:
- It is always a good time to buy.
- It is never a good time to sell.
In reality, investments that we hold when unmarried at age 25, are not appropriate at age 40 with kids. Of course, you have to sell to get the down payment for a house/car. With grandkids in mind, the investment mix should change.
Ideally, these changes don't suddenly in dramatic steps. If they do happen that way, it is often under duress. It is better to trade regularly under controlled circumstances as you mature rather than taking undue risks late in life.
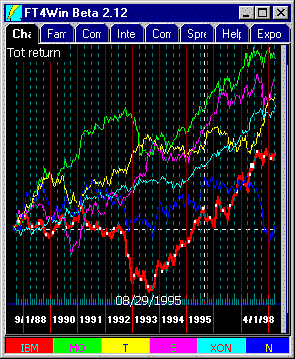 While those who hold a diversified portfolio of securities over the long-term can
expect to profit, the task of choosing what to buy can be daunting as the chart to the
right suggests. Selecting among venerable names like IBM, Phillip Morris, and
other old line companies with single-letter trading
symbols yields erratic individual performance.
- What should you buy and hold?
- Which company is fundamentally going highest next year?
- Which is likely to produce the most return with the least risk?
Investing with fundamentals is not easy. Although IBM, Sears, AT&T, Exxon, and Phillip Morris are likely among names that you have known about since you were child, you probably have no idea of their future profit potential. Further, you will likely have no further insight after reading the annual report or 10-K filings on the Internet.
2008 Update: Prophetically, when we wrote the above words in 1998, we never expected 4 of the 6 companies cited in 1`998 to disappear or become unrecognizable during mergers, financial crisis, and economic changes.
What to do?
Fundamental and Selection Strategy: Buy Index Funds
- individual investors cannot beat the market. Instead of picking stocks, the individual merely buys a fund that holds many large companies.
Of course, that leaves open the consideration of what is the market. This chart compares two Vanguard index funds
- the S&P 500 Index fund (VFINX) in red, a fund of the US markets' largest 500 stocks.
- the Total Market fund in green (VTSMX) holds a very wide range of US based small, mid, and large cap stocks although largest chunk of the Total Market fund is actually its S&P 500 stocks.
Selection is an Issue
While the S&P 500 holdings makes the two lines seems very similar . . . The difference between the lines is enhanced in FastTrack's Relative Strength chart. The Relative strength chart shows a bottom in early 1994 where the Total Market fund stopped beating VFINX. When the lines of the Relative Strength chart rise, the red line is doing better than the green line.
Since early 1994, holding an index fund as an investment strategy turns out to have done quite well. But any investing philosophy when followed by everyone eventually proves wrong. In this case, buyers of the S&P 500 did "beat" the broader Total Market
The 1997-1998 short relative strength downtrend suggests that investing in the S&P 500 may not continue to do relatively better than investing in smaller segments of the market. The appropriate tactic would be to switch now (4/1/98) to VTSMX, but to trade back if the downtrend in the R Chart breaks.
Fundamental and Selection Strategy: Sector Investing
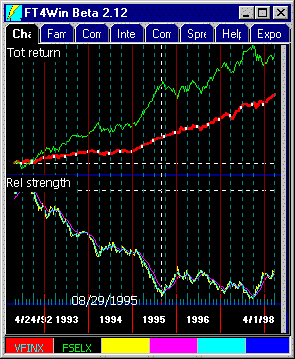 Some sectors of the economy are growing faster than the average and have
enormous future potential. Till August 1995, the most prominent hot sector was technology
as expressed in the Fidelity Select Electronics Fund (Green line).
Some sectors of the economy are growing faster than the average and have
enormous future potential. Till August 1995, the most prominent hot sector was technology
as expressed in the Fidelity Select Electronics Fund (Green line).Since then, the Relative Strength Chart (R Chart) shows that the Vanguard S&P 500 Index fund (VFINX) has done about the same as Fidelity Select Electronics. When the lines of the R Chart moved horizontally, then neither the red nor the green line has been favored.
While, most investors would agree that technology issues will continue to grow faster than the S&P 500 in the long-term. This fundamental seems to be having little impact since 1995. This case of failed fundamental analysis could have been corrected with technical analysis.
The technical outlook is that the green line will take a sharp correction sometime in 1998-1999 and then bounce back sharply moving to new highs. The fundamental high growth of technology will eventually reassert itself after a several-year period of ordinary performance.
For more examples: See Picking Sectors. or See Sector Momentum Modeling.
 There is a right time and a wrong time to invest in any particular sector
of the market:
There is a right time and a wrong time to invest in any particular sector
of the market:This is a problem for professional investors who cannot shift huge asset allocations between sectors quickly.
This is NOT a problem for small investors who can shift all assets with a single phone call to an 800 number today.
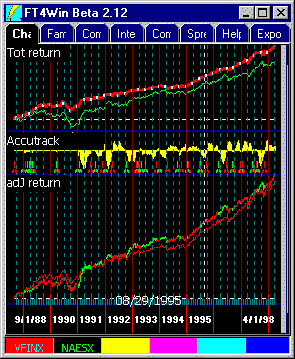
The chart shows switching between a large cap fund (VFINX) and a small cap fund (NAESX) using the AccuTrack technical indicator. The strategy trades less than 3 times/year, spends 60% of its time in VFINX and produces better returns than holding either of the index funds.
The strategy takes advantage of long, slow market sentiment rotations. There is no market timing. The results are produced as shown by being fully invested all the time.
Technical Strategies: Timing: Buy Low, Sell
High 
Since there is little risk that buying and holding will lose money in the long-term, the reward for holding long-term is commensurately low. Therefore, some stock and mutual fund investors try to "beat the market". There are two ways to execute this strategy: Timing and Selection.
The attractive aspect of perfect timing is that it eliminates risks of owning broad growth fund investments while improving return. Perfect timing would assure excellent returns with virtually any investment and would eliminate the need to practice selection. See Timing Indicators.
Unfortunately, while timing is a simple concept, it is not an easy discipline to follow over many years and is not the best way to beat the market. Imperfect timing usually does reduce risk, but also reduces return. FastTrack does provide market timing tools; and the tools are useful . . . but investors should focus on selecting the best issues and not timing the market. See Selection Strategies.
Perhaps the worst aspect of timing is its interaction with uncertainty. If your indicator gives you a trade, then you MUST take that trade immediately. But new technicians are always uncertain and seldom work at the analysis with the frequency required. If the indicator is of value, then the target stock or fund will immediately begin a dramatic move after the signal . . . waiting means you will be buying nearer highs and selling nearer lows. Delays mean you "Buy High, Sell Low".
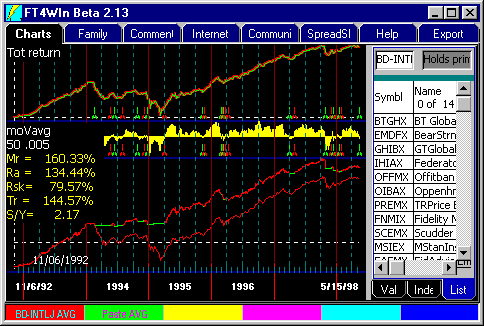
Emerging Market Bonds (BD_EMERGEfamily)
Back in 1992 when these funds got going, they invested primarily in Brady bonds . . . Foreign instruments guaranteed for principal payment by the US government. They were listed as BD-INTLJ, but with growth of the sector, investments have diversified into foreign corporate debt.
The funds have, in general, become less volatile and more diversified. Returns have been strong despite the rise in the dollar which reduces the value of the portfolio.
In the past a moving average has proved an effective timing tool although worthless during trendless periods such as mid1997- mid1998 (current).
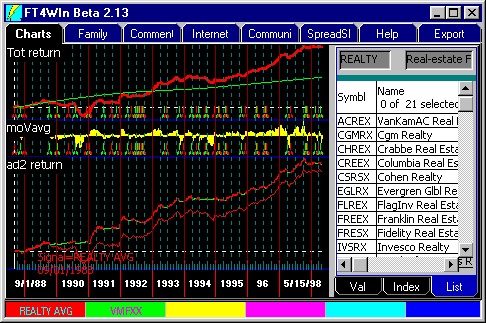
Realty Funds
These funds time well with moving averages. Comments about NOT using moving averages in trendless periods still apply.
Most of these funds have no trading restrictions, but check with your fund company to be sure.
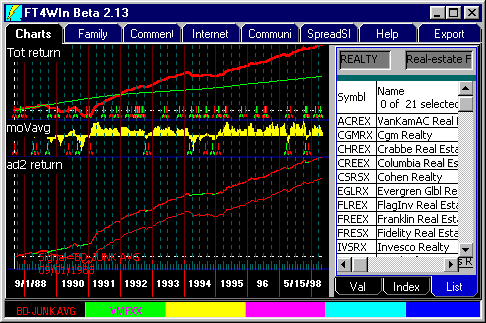
Junk Bonds BD-JUNK
These are primarily US corporate debt instruments of lower quality. Except during the 1989 Drexel Burnham debacle and short-term dips, these funds have provided strong returns with minimal risk.
They time well with a moving average as do all issues with strong day-to-day serial correlation . . . that is, an up day is usually followed by another up day, and a down day is usually followed by another down day.
Most funds have minimum holding periods. The whipsaws shown in the signals could have been avoided using trend lines to confirm the signals.
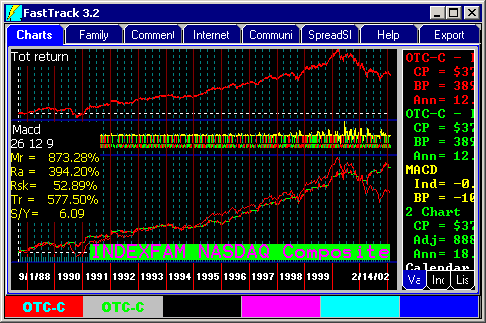
Momentum Timing
MACD, the M Indicator, is an good momentum timing indicator. Use it with issues that spurt. Generally, these are smaller, hot issues. It is difficult, but not rare, for a member of the S&P-500 to spurt.
Timing shows an increase in return for the NASDAQ composite, and a substantial decrease in risk.
Parameters used were MACD 26 12 9. There is a 5-day trading delay.
Momentum Timing with Stocks
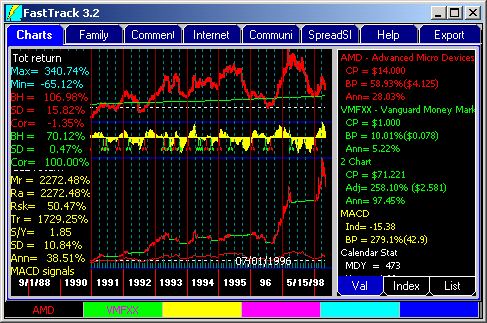
American Micro Devices (AMD) is volatile. This is the type of issue that times well with MACD. Look for companies that
- Show substantial past gains.
- Are in a hot, growing industry.
- Have an SD above 10%.
This indicator is useful with mutual funds from the view of reducing risk, but will usually also reduce return.
