Distributions
 When the Dashed Pole rests on a day with a distribution a distribution
information box will pop up for the mutual fund or stock in red. When the Dashed Pole rests on a day with a distribution a distribution
information box will pop up for the mutual fund or stock in red.
Right-click on distribution information box to disable it. '
To enable the distribution information, right-click on the date label that
follows the pole. (This date label expands to show the dividend summary.)
|
Performance Values "Between the Poles"
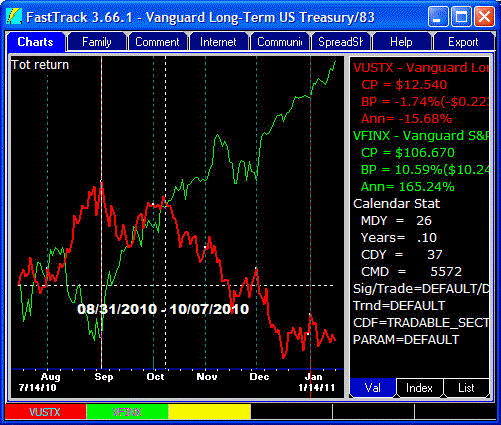 Performance values showing the performance of the mutual fund or
stock during the date range are located in the column on the right side of the chart.
Performance values are calculated from the Dashed Pole to . . . Performance values showing the performance of the mutual fund or
stock during the date range are located in the column on the right side of the chart.
Performance values are calculated from the Dashed Pole to . . .
- the end of the chart when no Solid Pole is planted.
- between the poles when a Solid Pole is visible.
Both case #1 and #2 above are often
referred to in this help as the period "between the poles".
To view statistics for a date range
- Hold down the shift key.
- Move the Pole to earliest date of the range.
- Plant a Solid Pole by clicking once with the shift key still held down. OR
release the Shift key and then hit the <Down arrow> on your keyboard.
- Click and hold the mouse in the center of the chart. Move to the latest date of your desired date range.
This should "drag" the Dashed Pole
The date label will show the date range. Performance values
on the right side of the chart will be calculated on this date range.
To remove the Solid Pole
- Move the mouse onto the chart.
- Hit the Ł key
The Date Label Can be Adjusted
Right-click date label to change the font and size.
Change the vertical position of the date label by dragging it to the desired level. To drag,
- Move the mouse over the date label.
- Click and hold.
- When the
 drag icon appears, drag the label to the desired vertical position.
- Release the mouse button.
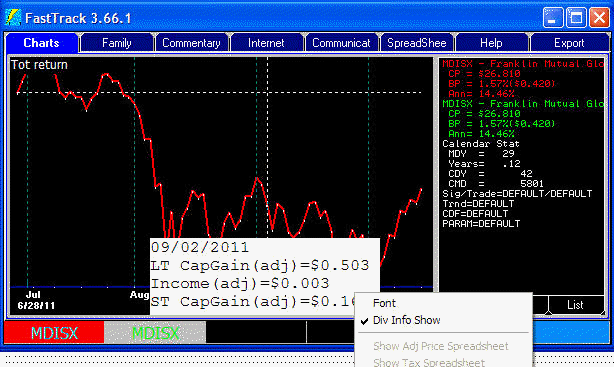
Distribution Summary
The date label discussed above changes to the distribution label when the Dashed Pole rests on a
distribution (white dot on the red line). Also, when the Dashed Pole is on the last date of the
period, a summary of distributions for the entire period displays.
- Font changes the font label. We recommend the use of Courier New
Font.
- Div Info show turns the display of dividend information in this
data label on/off.
-
Show Adj Price Spreadsheet. This causes and file
named,
C:\FT\FT4WIN\TEMP\FTDIS.CSV
to be written. Loading this file into Excel will show how FastTrack
adjusts the red line prices for distributions. The file is still
present even if the menu item is grayed out (FT cannot start Excel
for some reason on your system). In this case, start your
spreadsheet and open the file manually.
-
Show Tax Spreadsheet: This is an
optional FastTrack program.
Finding the Highest Priced Day for a Mutual Fund or Stock
While moving the Dashed Pole with the mouse, hold down the <Ctrl> key. The Dashed Pole will lock onto the day of the highest red line price that the mouse passes along.
Finding the Lowest Priced Day
While moving the Dashed Pole with the mouse, hold down the<Shift> + <Ctrl> keys. The Dashed Pole will lock onto the day of the lowest price that the mouse passes through.
|