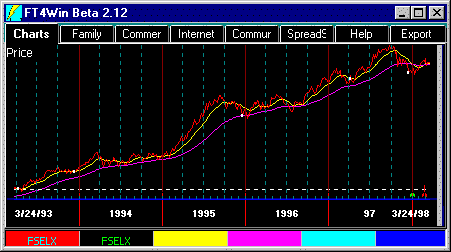
Price Chart
last updated
June 17, 2014
Price chart is an alternate form of the moving average indicator therefore considered a
trend-following indicator. When price or short average crosses the long average, then, the Price chart gives a signal.
-
The Price Chart, like all trend-following indicators, works best when the price is in a strong uptrend or a
downtrend.
- Price Chart, like all trend-following indicators, is useless
when the market moves sideways trendlessly.
- Disclaimer: No technical indicator can assure profits. As market conditions change, the
interpretation and use of the indicator must change.
The P Chart draws a red distribution-adjusted line of total return, a long purple
moving average, and a short yellow moving average on the chart.
- There is no provision for
more than one issue to be displayed on the P Chart.
- Set the short parameter = 1 to make the yellow average disappear.
- If you enter a longer value in the short parameter than in the long parameter, then the
signals will work in reverse.
- All moving averages used in P Chart are exponential averages
of the adjusted closing price.
General Interpretation of the P Chart
When the red line, or the short-average, is above the long average, the issue is in an uptrend and should continue
to be held. When the red line, or the short-average, is below the long average, the issue is in a downtrend and
should be avoided.
Volatility Control
For volatile issues that give too many trading signals, increase the length of the averages,
and/or increase the length of the trading delay.
The Purple and Yellow Values
These values tell the value of the average on any given day. These values display either as
adjusted or unadjusted values depending on the settings on the Chart's
right-click Menu.
Strengths and Weaknesses
The P Chart is FastTrack's best tool for finding trend starts and ends. Once a long, strong
moving average has been broken on the P Chart, stop using the P Chart and begin using a trading-range
indicator like the I Chart and the S Chart.
Parameters
The P Chart has two parameters which can be changed in the
Parameter settings dialog box. Parameter Short Avg is the length in days of the short
yellow moving average. Parameter Long Avg is the length in days of the longer purple
moving average. The yellow line crossing the purple line moving upward, creates a BUY tic.
The yellow line crossing the purple line moving downward, creates a SELL tic.
If the parameter values are identical, then only the red line and purple line are
charted. In this case, the BUY/SELL signals occur when the red line crosses the purple
line.
 What does this
mean to me? What does this
mean to me?
Moving averages are best suited for finding the end of a long, strong trend. Once the
end has been found then, STOP using trend-following indicators and start using
trading-range indicators. For more detail, see the
discussion of timing indicators.
|