Changing the Charts Displayed
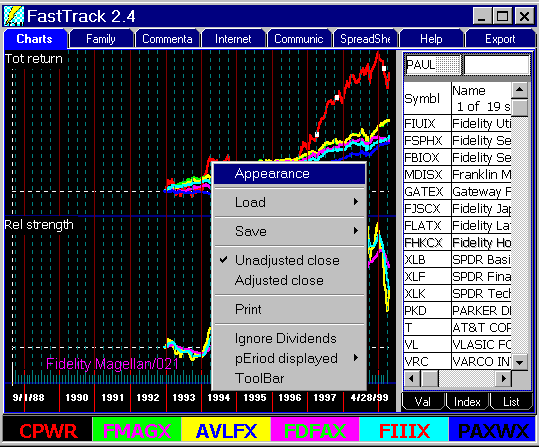
Right-click on the chart to get a list of properties and methods that apply to the
chart.
From the Appearance dialog,
you can,
- Split the chart into six sections.
- Change the line, background, and text colors you see.
- Control the way averages are computed.
- Select Modeling
- Plot arithmetic lines or semi-log lines (constant rate of return is
a straight line)
- Set the chart size.
- Control the content of the flexible I Chart
Click to see Other Menu options.
|
|
Displaying the Right Lines in the Chart Tab
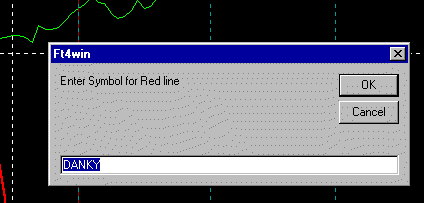
To get a particular symbol to display on the screen. Click on the chart so that key
strokes are directed to the Chart object. Hit . . .
- R for the red line
- G for the green line
- Y for the yellow line
- P for the purple line
- C for the cyan line (light blue)
- B for the blue line
Next, type the ticker symbol into the popup entry box.
| 
There are other techniques to change the issues
displayed.
|
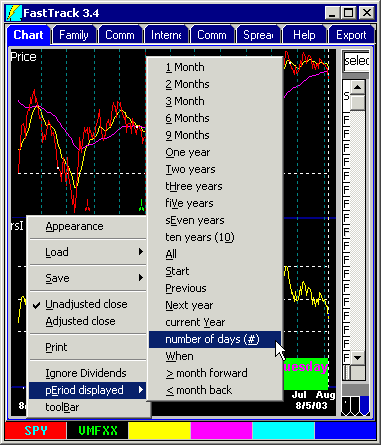
To Change the Period Displayed.
- Right-click on the chart to popup these menus.
- Or, move the mouse into the date zone at the bottom of the chart
and hit a single letter denoting the period you want displayed. The valid letters are the
capital letters in the pop up menu in the example to the right.
- Or, set the pole positions, move into the Date
Zone, and hit Z. This zooms the view to include only the days
between the poles,
inclusive.
- Selecting number of days pops up an entry box where you may enter the
number of market days you wish to have displayed. The last date is
always
|
|
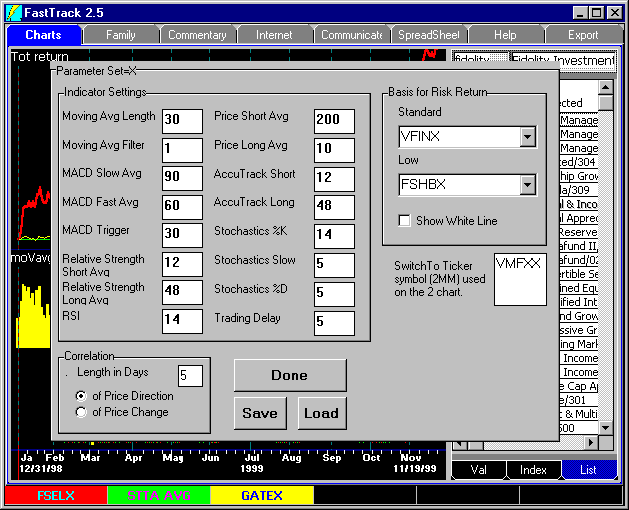
- Click the chart object
to direct subsequent key strokes to the chart.
- Hit U. This pops up the Parameter Dialog.
Alternately, right-click on a chart or indicator label object like "Tot
return" in white letters in the top left corner of the chart.
The parameters values you choose govern the why the
technical indicators work.
The Perfect Parameters
There are no magical numbers that always work. More important than the numbers is the
way you interpret what you see. Do not spend a lot of time trying to find perfect
parameters.
Click here for more help on setting parameters |
 |
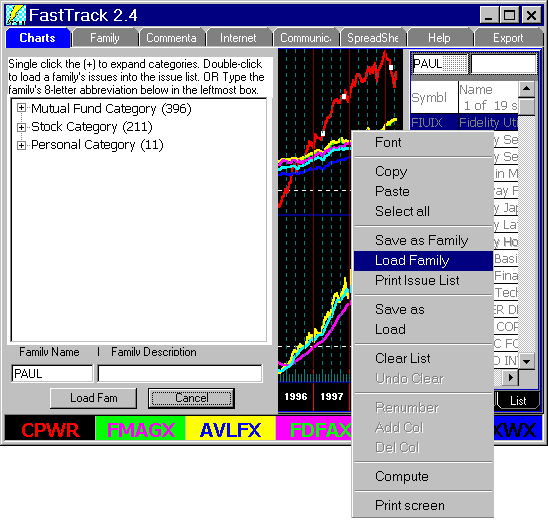 Loading the Chart Tab's Issue List Loading the Chart Tab's Issue List
- Right-Click on the Issue List
- Select "Load Family".
- Pick the family from the Family Tree to the left.
OR, Enter the Family name in the family name box and click "Load"
To pick a family from the family tree you have to expand the Categories to see the
subcategories and individual families. Click for more
details.
Note: You cannot exactly duplicate the image displayed to the right. The menu
disappears before the family tree appears. This image was cut and pasted to form a
composite.
Load a Family the Quick Way
- Click on the Issue List.
- Hit the [Control] + [M] on the keyboard.
- Type the name of the family to be loaded.
- Hit the [Enter] key on the keyboard.
You must already know the name of the family.
|
Chart ToolBar
To cycle through the funds, work with signals, draw
trend lines , rank the funds, or pick funds, use the "Chart
Tools" toolbar |
 |
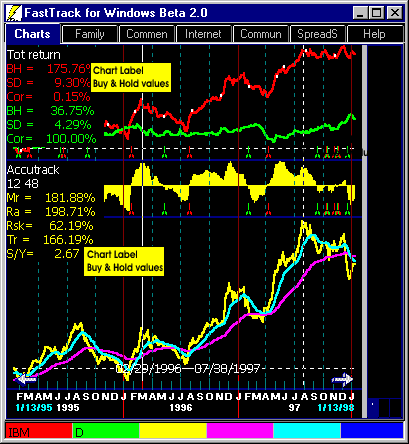
Chart Label Buy and Hold Values
Depending on the chart being displayed the Chart label shows parameters, the name of the chart/indicator,
and statistics over the entire period displayed. Unlike the Performance
SubTab Values, Char Label Buy and Hold
values are for the current span of the chart and NOT for the period between poles. Click
for more details |
 |
SubTabs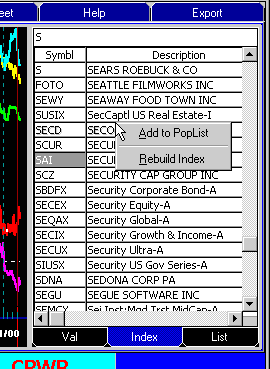
This is an area to the right of the Chart. It includes the Val, Index,
and List Subtab.
Index SubTab
The Index list contains all the ticker symbols and names of
issues available in your FastTrack databases.
There is an entry box at the top of the list. As you type a ticker
symbol or issue name into the entry box, the index list scrolls to a
matching row.
In the example to the right, we entered S
for Sears (symbol S). To do this, we had to enter the S and then two
spacebars. The spaces distinguished the single letter S from all matching
symbols and names that begin with S.
Changing the Lines Charted
Drag from the Index SubTab list to a cell of the ColorBar to change the line
displayed.
Right-Click the Index SubTab
- Add to PopList: This adds the selected issue to the Pop List.
- Rebuild Index: If you use 3rd party programs that create FastTrack
FNU files, these files will not automatically be added to the Index
List. Click the menu item to update the Index List
|
The Val SubTab
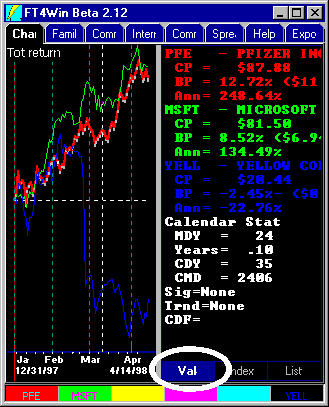
Click the Val Tab (Circled). This displays performance values.
These values are color coordinated with the lines on the chart.
Each value has an identifying abbreviation. This information
measures the performance of each line.
When both the Dashed Pole and the Solid Pole are visible,
the measurement is "between the poles". When only the
Dashed Pole is visible, the "between the poles" measurement is between the Dashed Pole and the last
(rightmost) date displayed.
Click for details on the Calendar Stats.
Click for defaults on Sig, Trend,
and CDF. |
|
The List SubTab
 This Subtab contains an Issue List that functions much like the
Issue Lists on other tabs. However, there is one
unique function: Build a family by using the Chart Tab Issue List and
the Index SubTab. This Subtab contains an Issue List that functions much like the
Issue Lists on other tabs. However, there is one
unique function: Build a family by using the Chart Tab Issue List and
the Index SubTab.
Building a Family
- Clear the Chart Tab Issue List by right-clicking and selecting
"Clear List"
- Display the Index SubTab.
- Double Click any issue. It will turn gray indicating that it has been
added to the Issue List which is hidden beneath the Index SubTab at this
moment
- Or, select an issue with the arrow keys, and
hit ¬
after issue is selected to add the selected symbol in to the
Issue List.
- Or, find and issue by typing in the <Entry Box>
at the top of the index tab, then hit ¬
to add it to the hidden Issue List.
- Finally, click the List
SubTab to see the results, and right-click the Issue
List to save the Family.
For more detail, Click to jump up on this
page to review all the functions of the Index SubTab, |

 Charts Tab


 Loading the Chart Tab's Issue List
