Fund Families and Categories
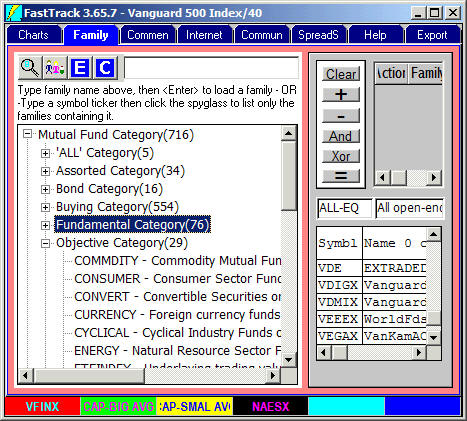
These families separate funds based on statistical and fundamental qualities. The Family Tab displays all the Fundamental and Objective categories. Click for instructions on using the Family tab. For a discussion and illustration of the individual families in alphabetical order, see below. Note not all families are listed here. Where the definition of the family is obvious (like Energy, Europe, HiTech, etc., the only definition is given in the family description. |
|||||||||||||||||||||||||||||||||||||||||||||||||
ADM and ADV Families |
|||||||||||||||||||||||||||||||||||||||||||||||||
|
|||||||||||||||||||||||||||||||||||||||||||||||||
| |||||||||||||||||||||||||||||||||||||||||||||||||
 Mutual funds and stocks are organized into buying families like Fidelity, Vanguard, etc. by
the name of the sponsoring investment company. Funds are also organized into objective
families like GROWTH, HEALTH, etc.
Mutual funds and stocks are organized into buying families like Fidelity, Vanguard, etc. by
the name of the sponsoring investment company. Funds are also organized into objective
families like GROWTH, HEALTH, etc. ALL Categories - The Broadest Classification of Fund
Types
ALL Categories - The Broadest Classification of Fund
Types|
Share Class Type FastTrack fund names have prefixes and suffixes that denote share class. These are defined in the table below. Regrettably, there are no clear standards. Make sure you know what your fund company charges. Suffixes are in form -A, -B, -I, etc. Prefixes are several capital letters followed by a colon. For example, ADM:, ADV:, INST: |
|||
| Prefix: or -Suffix |
Front Load |
Back Load |
Minimum Investment |
| -A |
Typically between 4% and 5.75% |
Typically will be zero |
Typically $2,500 or less |
|
ADM: ADV: These shares are usually used by fee-based money managers for their clients. However, there is no standard definition of these terms. Generally, Individual investors would not buy ADM or ADV shares when there are other classes of the same funds. Most individuals should use the Family Tab sieve to remove these shares from their personal families. |
Usually 0% |
Typically 0% |
Typically
|
| -B, 2, -II |
Usually 0% |
Typically between 4% and 5% |
Typically $2,500 or less |
| -C, -3, -III |
Typically 0%. Occasionally 1% |
Typically 1%. Occasionally 0% |
Typically $2,500 or less |
| -D |
Usually 0% |
Typically 0%. Occasionally 1% |
Typically $2,000 or more |
|
Inst: -Y, -I,- Z, -X |
Usually 0% |
Typically 0% |
Typically $25,000 or more |
|
Inv: -N,-R, -S These are generally bought by the individual investor directly from the fund company. In some cases, they may be bought from a brokerage |
Usually 0% |
Typically 0% |
Typically $10,000 or less |
-K,-J,-RThese are typically available only in nontaxable retirement accounts |
Usually 0% |
Typically 0% |
Varies |
| -S |
Usually 0% |
Typically 0% |
Typically $2,000 or more |
-TCommonly purchased through an adviser |
Mostly 0%, Sometimes between 3% and 4.75% |
Typically 0% |
Typically $2,000 or more |
 ASSTALLC Asset
Allocation: These funds shift allocations primarily between Bonds, Cash,
and large cap equities. However, they can also shift among domestic & international
funds, long bonds to short-bonds . . . or all of the above. The allocation
can be for aggressive gains, principal conservation, or changes in lifestyle
of the fund holders. As such, Asset Allocation funds can be quite diverse, and may
work well with momentum trading strategies among differently managed asset
allocation funds.
ASSTALLC Asset
Allocation: These funds shift allocations primarily between Bonds, Cash,
and large cap equities. However, they can also shift among domestic & international
funds, long bonds to short-bonds . . . or all of the above. The allocation
can be for aggressive gains, principal conservation, or changes in lifestyle
of the fund holders. As such, Asset Allocation funds can be quite diverse, and may
work well with momentum trading strategies among differently managed asset
allocation funds.
Note: Balanced funds used to have their own family, but have been absorbed into the ASSTALLC family.
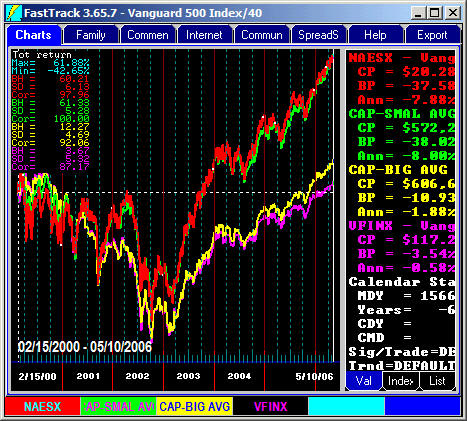
The chart shows
- green Vanguard S&P 500 Fund,
- red ASSTALLC daily AVG.
- yellow AVG that is
50% VFINX
+25% VMFXX money market
+25% VUSTX Long Treasuries
While all are highly correlated, the static yellow allocation has the best risk adjusted return. For the history of the FT database AsstAlloc fund managers have done little effective allocation. Actively trading FastTrackers will likely do quite a bit better avoiding AsstAlloc funds.
Brokerage Families
Obsolete: These B-m families have been discontinued. Instead, use the Sieve to combine the InvUniverse family with broad families.
For an easy example, Click here.
 Bond Fund Families
The high quality bonds of US companies and the US government differ a bit in return and volatility . . . but not much. Note the lower cluster of 4 lines that follow the same pattern.
Junk bond mutual funds (light and dark blue lines) are different creatures. Try timing these mutual funds using a 30-day moving average. Most mutual fund companies have restrictions on the amount of trading you are allowed to do.
-
The BD-INTJ family contains mutual funds that hold international junk bonds. The holdings used to be primarily of securities termed "Brady Bonds" whose principal payment is guaranteed by the US government, but whose dividend payments are not guaranteed. The value of these bonds is greatly influenced by the financial stability of the issuing country and the word monetary situation. Increasingly, however, the mutual funds are investing in emerging market debt including debt of Eastern European countries.
-
The BD-JUNK family mutual funds hold primarily US corporate bonds are of lower quality. These bonds took a drubbing in 1990 during the Drexel Burham debacle, but since then have recovered nicely.
How Different are the Bond Families?
The higher quality bond differ only by volatility and return. BD-JUNK (US Domestic lower quality corporate bonds) and BD-EMERGE (emerging markets bonds) are entirely different creatures.
 Bond
Families
Bond
Families
-
BD-CORP General Corporate Bonds
-
BD-EMERGE Emerging market Bonds
-
BD-GLOBAL Global Bonds including
-
Discontinued- BD-INTLJ International Junk Bond Mutual Funds
-
BD-INTMD Intermediate-term maturing 4-10 years.
-
BD-INTNL International Bonds not Including US
-
BD-JUNK High Yield Corporate Bonds
-
BD-LONG Long-term bond mutual funds of all types
-
BD-MORT Mortgage bonds (Ginnie Mae) GNMA
-
BD-MUNHIYLD Municipal Hi-Yield bond funds
-
BD-MUNI General Municipal Bonds
-
BD-SHORT Short-Term bonds < 4 years
-
BD-USGOV US Government bond funds of all types
-
BD-ZEROC Zero Coupon Bond Funds
Red, green, and yellow lines show long, intermediate, and short-term maturity bond funds. The longer the more volatile and higher return.
The purple and cyan lines illustrate US government bonds of mixed maturities. A daily AVG looks much like the intermediate bond line. However, when the FastTrack Momentum Model is applied, to BD-USGOV AVG the importance of allocation shifting becomes apparent . Note the flattening of the AVG in downturns compared the the BD-LONG AVG plus the very strong return.
Classification by the Portfolio Holdings Size
The family named start with CAP-, and will be found in the Fundamental Category. These families characterize the size of the companies whose stocks are held in the mutual fund's portfolio. The names are obvious except for
CAP-ALL - Holds any stock
CAP-NLG - Holds everything but large cap.
CAP-NA - Holdings cannot be evaluated.
CAP-NSM - Holdings include big and mid size companies, but not small companies
The numerical boundaries of the families shift slightly every time we make the families (about every 60 days). The description of the family that you'll see within the Family Editor shows the criteria that were used to pick the family.
- If you'd like your mutual fund managers to discover all the great new young companies and ride their success to fortune, then take a look at the CAP-MICR (MicroCap Mutual Funds) families.
- If you're more into preservation of capital, then look at the CAP-BIG mutual funds that invest in more mature and stable companies.
You'll be surprised that some "Small Cap" mutual funds by name don't fall into the CAP-SMAL category . . . in the mid 1990's with the surge in Large Cap stocks, many Small Cap fund managers fudged on their objectives. With the surge in small cap stocks in the early 2000's the large cap fund managers did the same. In general, mutual funds tend to invest in the largest companies in their target segments since liquidity is usually better when trading these stocks. Therefore, many "SmallCap" funds invest in companies you would consider quite large.
When we rebuild families, we attempt to balance the categories of funds such that LargeCap and SmallCap funds are distributed approximately as follows:
CAP-BIG 1/2 of all equity funds
CAP-MID 1/3 of all equity funds
CAP-SMAL 1/4 of all equity funds
CAP-MICR, CAP-NLG, CAP-ALL, and CAP-NA comprise the rest. Requirements for CAP-MICR are quite stringent and the family size varies overtime
How Accurate are FastTrack's Characterizations?
CAP-BIG AVG is 98% correlated to the Vanguard S&P 500
CAP-SMAL AVG is 98% correlated to Vanguard Russell 2000
CAP-SMAL to CAP-BIG Trading Strategies
-
CAP-BIG Biggest cap, typically holding stocks in the S&P 500.
-
CAP-MID Mid Caps, holding stocks that in the S&P Mid Cap Index (SP-MC).
-
CAP-NA Market cap not known
-
CAP-SMAL - Small Caps, typically holding stocks in the Russell 2000 Index (RUT-I)
-
CAP-MICR Micro, smallest cap. There is not general wat to characterize holdings. The mutual funds are usually not well correlated with each other.
CONVERT Convertible Securities
These mutual funds invest in convertible issues. Convertibles offer holders the opportunity to convert part or all of the shares to bonds or equities. As such CONVERT mutual funds are less volatile than the yellow broad market line as CONVERT mutual funds value and return is somewhat protected . . . however, such protection comes at the expense of gains.
Not surprisingly, the green Vanguard Convertible Fund (VCVSX) looks much like the red average of all CONVERT mutual funds. Most Vanguard mutual funds invest broadly in indices. The greater returns of the purple Fidelity Convertible mutual fund (FCVSX) comes at the expense of greater risk.
- CURRENCY Money fund denominated in a foreign currency
- CYCLICAL Specializing in cyclical industries
ExTraded Family now called ALL-ETF
These are mutual funds that trade like stocks. For more see Wikipedia .
Click for a discussion of trading ETFs
Most ETFs have an index based of the holdings of the ETF. Many of these indexes can be found in the INDEXFAM. The index is the basis for evaluating an ETF's NAV. FastTrack provides the closing prices for these ETF indexes so you can compare the ETF's day-to-day change to it's target index. Also, when the ETF-Index is available via real-time charts on the internet, the "Trading Range" option in the Internet Tab will show you how far the ETF is trading from it's index. You should consider the gap between an ETF and its index an expense much like a load. The gap is commonly 0.5% on every buy and sell. For the most popular and most liquid ETF's (Like SPY and QQQQ) the gap is rarely more than 0.1%
Classification by Fund Size (Total Assets)
Big mutual funds (FS-BIG) with Billions and Billions in assets have a hard time trading. Their sheer size means they can trade only very small portions of their portfolios each day. Their own trading could move share prices dramatically in the wrong directions. The impact is less when large market cap stocks are traded vs. small market cap stocks.
Aggressive investors, generally, prefer to hold mutual funds with small total assets. The numerical boundaries of the families shift slightly every time we make the families. The description of the family that you'll see within the Family Editor shows the criteria that were used to pick the family.
- FS-AVG
- FS-BIG
- FS-GIANT Industry steamrollers like Fidelity Magellan
- FS-NA - Asset size unknown
- FS-SMALL
- FS-TINY The smallest of mutual funds.
When using FS-SMALL and FS TINY consider removing the enhanced index and bear funds that are part of the family. These substantially impact the averages.
The results above illustrate a bias going back into history . . . Funds that did well in the past attracted assets and are no longer in the FS-TINY family.
 Classification of "Growth" Mutual Funds
There is no more ambiguous term applied to mutual funds than "growth". Here's how FastTrack separates this universe.
GROWTH Typical Growth Equities
These diversified mutual funds must have a modest annualized income distribution
(less than VFINX), hold mostly
equities, and have a Standard Deviation in the mid-range of all diversified,
domestic equity funds.
GROWINC Growth and Income Equities
These diversified mutual funds must have an above average stream of income distributions
(more than VFINX, but less than VIVAX), hold at
mostly equities, and have a Standard Deviation in low-range of all diversified,
domestic equity
funds.
INCOMEQ Income Equities.
These diversified mutual funds must have strong income distributions
(more than VIVAX), hold at mostly equities,
and have a Standard Deviation in low-range of all diversified equity funds.
GROWTH-N Growth in-the-Name Equities
The GROWTH-N family is made in a simplistic manner. It includes
funds that have the word 'growth' in its name and that hold at least 80% of assets in equities. Mutual funds whose names include the
words, 'income', and 'aggressive' are excluded. There has been no statistics used to characterize
the mutual fund's style, holdings, or management philosophy.
HEALTH Health Care Sector Mutual Funds
HITECH High Technology Sector Mutual Funds
INDEXFAM The family of all the various market indices. This also includes data on hew highs, volume, etc. The AVG of this family is NOT meaningful because the nature of some of the data ( for example advances, declines, new highs, new lows) is highly volatile and does not display well with fund price data. For more detail see IndexFam Explained and Amplified
INDEXFND high correlated to a relevant index
INST Institutional Class funds . See assorted families .
INV Investor Class funds . See assorted families .
International Families
- ALL-INT All international mutual funds including bond and equity funds.
These are mutual funds of all types (bonds, stocks, convertibles, etc.) that MUST invest at least 50% of assets outside the US. This does not include mutual funds that are listed under GLOBALEQ and BD-GLOBL category that may invest a large portion of assets in the US. - BD-GLOBAL Global bonds including US bonds
- BD-INTNL International Bonds (not significantly US bonds)
- BD-EMERGE Emerging markets bonds.
- BRIC: Brazil, Russia, India, China. These funds are a subset of the most promising (as of 2008) emerging market funds. They are also included in the ALL-INT and INTERNEQ families.
- EMERGE Emerging Markets Funds. Includes broad-based funds with investments in 2 or more regions, for example, funds holding both in Asia and Latin America.
- EUROPE Western European Equities. EUROPE family funds invest regionally in many countries or in European single country funds. EUROPE funds may also be found in ALL-INT, INTERNEQ, SINGLE, and EMERGE families.
- GLOBALEQ Global Equities including US equities These mutual funds invest in common stocks anywhere in the world including the US. Some of these mutual funds resemble broad-based international funds. Some resemble the S&P-500. It all depends on the style of management. These mutual funds have the charter to invest anywhere whereas INTERNEQ funds must invest (usually, almost, entirely) outside of the US.
- INTERNEQ International Equities: These broad-based funds that invest in the stocks of many countries or single regions, but not in the United States headquartered companies.
- JAPAN - Japanese Securities. These are also found in the SINGLE, ALL-INT, and INTERNEQ families
- LATIN - Latin American Securities Includes single country funds for countries in Latin America. LATIN funds may also be found in the SINGLE, ALL-INT, and INTERNEQ families
- NEW-ASIA- Asian nations NOT including Japan. Includes single country funds for countries in Asia. NEW-ASIA funds may also found in the SINGLE, ALL-INT, and INTERNEQ families.
- PACIFIC: Investing in companies headquartered in countries bordering the Pacific Ocean including Australia, New Zealand, Japan, and many Asian countries. However, not including the United States. PACIFIC funds may also found in the SINGLE, ALL-INT, and INTERNEQ families.
- SINGLE - Single Country Funds These funds invest in a single country. They are included in the broad families like INTERNEQ , and in regional categories like LATIN, EUROPE, NEW-ASIA, and PACIFIC. Of course, they are also in the ALL-INT family. The are never found in the GLOBALEQ.
InvUniverse
These are funds bought by individual investors. These funds have no loads, and modest fees. The great majority of these funds can be purchased by your brokerage for your account. Use the Sieve to combine this family with any broad group of funds to replace the B- Families which were discontinued.
Leveraged
These funds are enhanced by the use of futures or other leveraging instruments to increase volatility while preserving correlation. Over short periods these funds go up and down more than their underlying index. These may be bull or bear funds (long or short).
However, there is so much expense built into these funds that over longer-terms, these funds can lose money on both the short and long side.
These are NOT buy and hold investments.
Classification by Load
It is impossible to characterize all the different load categories. For the most part, we have computed the load at the highest fee charged if the fund were bought in January and sold in December of the same year. Some mutual funds have a redemption fee that disappears with time. If it disappears within a year them we consider the fund to be a no load.
- LOAD-AVG Load is 3-4.5%
- LOAD-HI :High Load > 4.5%
- LOAD-LOW: Load is 3% or less but not 0%
- LOAD-NA: Load is unknown or has a complex tier of charges.
- LOAD-NO No Load fund (may have 12B-1) %
Classification by Manager Tenure
The experience of the manager is often believed to be a factor in the performance of a mutual fund. This issue is clouded in that the more aggressive funds and sector funds tend to turn over managers more quickly, yet these mutual funds can be top performers for long periods. The more conservative mutual fund managers tend to stay on the job longer, yet these mutual funds by design underperform the more aggressive mutual funds. In our classifications, we took into account the time during which the manager has managed his current mutual fund AND his tenure at comparable objective funds. Therefore, a relatively young mutual fund like the Yackman fund has a senior manager since Donald Yackman has a long record at managing other aggressive growth mutual funds in the past. The best use of this family is to sort out mutual funds that are of the same objective. For example, using FT's family editor to separate long manager tenure BALANCED or GROWTH funds from short manager tenure funds. The numerical boundaries of the families shift slightly every time we make the families. The description of the family that you'll see within the Family Editor shows the criteria that were used to pick the family.
 Classification by Mutual Funds Manager Tenure
- M-AVG Manager has average experience, typically 3-6 years.
- M-LONG Manager is experienced, typically more than 6 years.
- M-NA No classification available
- M-SENIOR Senior fund management, typically more than 9 years
- M-SHORT Manager has limited experience with fund, 1-3 years. %
Seems pretty obvious that manager tenure is a minimal influence. However, bond managers tend to stay on the job longer than equity managers. The would lower the return and volatility of the M-SENIOR family (and this is what the chart shows.)
Since these AVGs contain both bonds and equity funds, you might consider using the family sieve to separate out the M- families' equity funds and then redraw the charts with the equity only families.
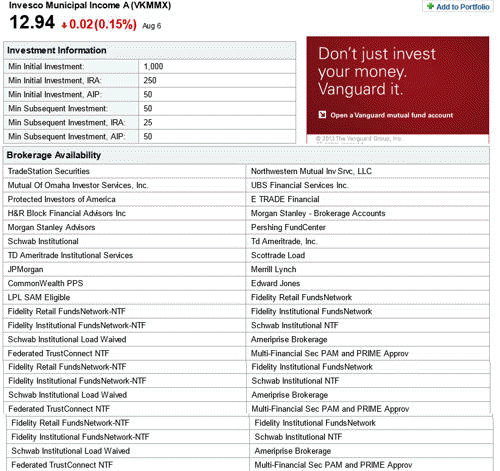
MONEYMKT Money Market Funds
VMFXX is a pretty good money market fund, and is the fund of choice that we have used in FastTrack trading examples since 1989. The average money market lags VMFXX.
FastTrack does not carry a huge number of money market funds.
Star Rating Families
These families were constructed using commonly available mutual fund ratings.
The upper grouping of families is for historical purposes. It suffers from survivorship bias. The best of funds still exists. The worse funds that were in the families are no longer in the FT Database.
The lower group is always 30-90 days old. the purpose of providing and updating the group is to help you determine the value of ranking in making your investment decisions
Determining the rating period
This is a relatively easy exercise.
- Display the daily AVG of the STAR-1 (funds ranked worst)
- Display the AVG of the STAR-5 family (Funds ranked best)
- Display the T and R charts.
- Move the pole to the month end where the flat portion of the R chart begins. This will the the last date of the period used for the star rankings .
Huh?
From the last day of the rating period, the worst star funds and best funds tend to perform about the same. The inflection point is not always as clear as in this particular example. Generally, however, the STAR-1 AVG will be slightly more volatile.
- PRECIOUS Gold and Precious Metal Sector
- REALTY Real-estate Funds %
-
SECTOREQ Sector Mutual Funds
-
SER: Service Class funds . See assorted families .
-
SOCIAL Socially & Environmentally Responsible
-
UTILITY Utility Sector Equity Funds %
 Value Oriented Mutual Funds
Value mutual funds invest in securities that the mutual fund manager considers under- valued or out-of-favor. Usually these are mutual funds that invest in mostly low P/E, domestic (US) securities.
- VALUE
These mutual funds the words are mostly highly correlated to Russell Values indexes. - VALUE-MS
Mutual funds of all types that are considered contrarian using information obtained from Morningstars - VALUE-N
- Mutual funds whose names contain the word "Value"
It is apparent that the the value concepts used by FT and Morningstar are very similar. However, neither method is much better than relying on the presence of the word "Value" in the fund name. Nonetheless, the designation "Value" clearly distinguished group of funds from the broad market in the 1998-2003 bull and bear markets.