Appearance Dialog, Momentum Model, Value Model
 Updated
03/11/14 Updated
03/11/14
To display these options (Appearance
Dialog), right-click on the
Chart and select "Appearance".
In the Appearance Dialog, you can change the way the chart looks.
|
Click for Trend Line Options
Click for Rebalance, Model, Rank By
Click for Chart Select Buttons
Click for Line Width Options
Click for Chart Size Options
Click for Chart Background Options
Click for I Chart Options
Chart Select
The entry box at the top of the Chart Select section provides a way to
display 1 to 6 different charts or indicators.
Click the buttons below the entry box or hand enter the desired letters to
fill the entry box.
For example,
 To display the Total return Chart (T Chart ) on all six zones,
click the Total Return button 6 times. The Chart Select box will then contain TTTTTT.
Actually, leaving the entry box partially unfilled will extend the size of the last chart
displayed sone only one click is necessary. To display the Total return Chart (T Chart ) on all six zones,
click the Total Return button 6 times. The Chart Select box will then contain TTTTTT.
Actually, leaving the entry box partially unfilled will extend the size of the last chart
displayed sone only one click is necessary.
 To display the T Chart, A Chart, and J Chart equally sized Click the
Total return button twice, the AccuTrack button twice, and the J button once or twice. To display the T Chart, A Chart, and J Chart equally sized Click the
Total return button twice, the AccuTrack button twice, and the J button once or twice.
-
OR, click on the Chart Tab and Hit the "D" key. This
will popup a box that will let you enter the Chart Selection such as TTAAJJ.
Note the abbreviations for each chart above.
Line Width
 Click to change the width of the lines displayed on the charts. Click the desired width
or enter the pixel width in the nonRed entry box. Click to change the width of the lines displayed on the charts. Click the desired width
or enter the pixel width in the nonRed entry box.
Notice that the width of the red line is set separate from the other lines on the
chart. This feature is used for making presentation graphics where you would want the
red line to stand out from other lines.
|
Chart Size
 Set the pixel width and height of FastTrack for the Web. If you don't like
the present small, large, and normal sizes, then enter your own pixel sizes in the Width
and Height entry boxes. Set the pixel width and height of FastTrack for the Web. If you don't like
the present small, large, and normal sizes, then enter your own pixel sizes in the Width
and Height entry boxes.
- Small=640 x 480
- Large= the size of your full screen (but not maximized)
- Normal fills the 90% of the screen size . . . you can still see the Windows
Desktop
- User Set: You fill in the size in pixels.
FastTrack will always look its best on a 800x600 or
1024x768 display. On a 640x480 display, you may not be above to see everything in the help. On
very large displays, the lines get thin and the letters small.
 Chart Background Chart Background
Click "Change" to bring up a color selection box which will
allow you to change the background color of the charts. Click "Default" to
restore standard colors.
Misc Settings
 Plot Log Scale Plot Log Scale
Determines whether the chart is drawn on a logarithmic rather than an
arithmetic scale. On a logarithmic scale, a constant rate of return is a straight line. On
an arithmetic scale, a constant rate of return is curved. The default is logarithmic.
Logarithmic (recommended) is best when viewing long periods and/or using trend lines ,
but logarithmic scale tends to diminish the recent action of a line. As such, you may wish
to use arithmetic scaling when viewing long charts, but making short-term decisions.
Show Distribution Info Check Box
When checked, FastTrack shows Distribution information when the
Dashed Pole is over a "white dot" on the Total Return Chart's red line. This can
be distracting if you are not interested in distribution information.
 Starting and Ending Dates of the chart Starting and Ending Dates of the chart
Enter new dates in the labeled boxes. Two formats may be used.
- mm/dd/yy . . . for example 01/01/00 (year 2000)
- mm/dd/yyyy . . . for example 01/01/1998
|
Chart Size and Line Width
 FastTrack will always look its best on a 800x600 or 1024x768 display. On
the smallest 640x480 displays, you may not be able to see everything in the help. FastTrack will always look its best on a 800x600 or 1024x768 display. On
the smallest 640x480 displays, you may not be able to see everything in the help.
On very large displays, the lines get thin and the letters small. Some
users note that FastTrack for the Web's lines are not as crisp as FT4 DOS screens. This is
due to the thickness of the lines. Under DOS's 640x480 screen, lines contain 4 times as
many pixels(dots) as on a 1024x768 screen. Increase FastTrack for the Web's
line width to compensate. This is especially important if you
plan to print the charts on a color printer.
|
 Rebalance and Averaging Strategies: Rebalance and Averaging Strategies:
Settings for Modeling
FastTrack can average the returns of a family of stocks,
mutual funds, or any mix of issues. For example, using the ticker
HITECH AVG
will compute the average of the HITECH family of sector
mutual funds. Using
LIST AVG (entering just "AVG" defaults to LIST AVG)
as a symbol will average the issues listed in the
Issue List. Or entering
SCREEN AVG
Will average the lines visible on the Chart (not including
other ... AVG lines). You may also paste issues from
the clipboard to a ColorBar cell and they will be averaged.
Methods of Rebalancing (Models)
The AVG computation depends on the Model settings. See below for the Momentum Model,
Value Model, and None Model.
Note: After changing a Model, you MUST recompute the AVG to
see the result.
- Right-click
ColorBar to recompute the AVG. This will use the same list of issues which
were previously used previously.
- Click on the ColorBar cell and this <Enter><Enter>. This will cause
the AVG to reload the issues used.
The computation has some complexity with respect to the inception
dates of the issues.
-
The average is computed by first dividing $100000.00 evenly among each
issue existing on 9/1/1988. This means that the computation of a 50 issue average would
start with $2000.00 in each issue if ALL 50 issues exist as of 9/1/1998.
-
As the computation progresses, the portfolio changes according to the Model
Strategy chosen. When new issues become available, they will enter the holdings when they become
top performers.
Rebalancing
Rebalancing takes the assets' value and divides it among issues. The
rebalancing method depends both Rebalance, Model. and Rank By options selected.
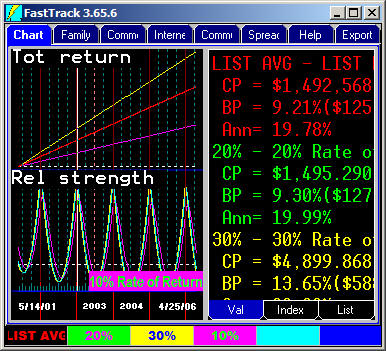
The charts below show the impact of the permutations of rebalancing and
averaging applied to 10% and 30% return lines. The green 20% line is shown for reference
purposes.
|
 Rebalance
Daily Rebalance
Daily
At the closing prices, all issues are effectively sold, the assets are
divided evenly, issues are rebought.
Each day assets are shifted from the 30% line to the 20% and 10%
lines. The Cyan Colored result
is very nearly the same as the green 20% annualized Total Return(CAGR).
There are slight differenced due to rounding.
Model and Rank By settings have no impact on Daily rebalancing, and
cannot be selected when Daily is selected.
The end results is a fair average, although it implies trading that
no one would actually try to execute. |
Never Rebalance
FastTrack does not rebalance at all.
This means that weak issues will, over time, become a smaller portion of holdings. A few
strong issues will become essentially ALL the holdings. The portfolio
becomes less and less diversified over time.
Never
rebalancing and Daily rebalancing averages look very much the same if the issues being
averaged are similar in pattern and performance, as would be the case averaging the GROWTH
family mutual funds.
In this chart, the assets in the 30% line stay there. There in no rebalancing to shift
assets to the lower yielding 20 and 10% lines. Therefore, the never rebalanced cyan AVG
of the red and yellow lines produces more return than the 20% green
line.
Model and Rank By settings have no impact on Daily rebalancing, and
cannot be used when Never is selected.
|
 Rebalance Weekly, Monthly, Quarterly, Annually Rebalance Weekly, Monthly, Quarterly, Annually
The rebalancing occurs on the last market day of the period. No rebalancing
occurs until a whole period has elapsed. For example, if you choose Annual rebalancing starting at
9/1/88, then the first day on which
rebalancing occurs is 12/31/89 because a whole year has not passed as of
12/31/88.
The difference between daily, monthly, and quarterly rebalancing
with Model=None is vanishingly small. However, with other Model and Rank by settings the
differences can be vast.
|
Modeling and Averaging
Momentum Modeling shows what would happen if you shifted 25% of your
assets from the worst performing issues to the best performing issues on the
first trading day of each period. The decision to trade is made on the last
trading day of the period.
FT's modeling isn't complex, optimized, or theoretical (when using families without
survivor bias). Use FastBreak
(3rd party product) if you want very sophisticated modeling.
The Average Daily Data Points
An average always starts with $100000.00 invested. The daily prices show the
total dollars invested on any each day. If you want to know exactly what is going on in
the rebalancing, then compute one AVG and, assuming you installed FastTrack in the
suggested folders, immediately print or view the file,
C:\FT\FT4WIN\TEMP\REBALANCE.LOG
This text file shows all the transactions associated with rebalancing
periods and new issues. It does not show the everyday gains due to market action.
The most recent 5 versions of REBALANCE.LOG are kept. The prior four are
named,
REBALANCE.X-1
REBALANCE.X-2,
REBALANCE.X-3,
REBALANCE.X-4
|
 None Modeling None Modeling
When there is no rebalancing strategy, then all issues in the family are rebalanced
to have the same dollar value at the end of the period. The Annual rebalancing of
the 10% and 30% lines showing in this chart has a interesting pattern in the Relative
Strength chart. The sine wave is generated as the compounding at 30% + 10% falls behind
a true 20% return in the first half of the year but then catches up by year end
(Remember, assets are shifted only once a year). The red
and green line are chart so close together that only the red is visible. The lover R chart
magnifies the very slight red/green differences.
When a new issue becomes available (when using a real family like Fidelity which adds
new funds over time), then it is purchased on the first day of the period after its inception date. For example, when there are 49 existing issues
held then, all are sold at the end of the period and the assets divided equally between
the now 50 existing issues. New issues are purchased only when
their performance qualifies them for inclusion at the end of a period.
|
 Using None Modeling Using None Modeling
 None
Strategy is is particularly useful when dealing with speculative stocks whose prices
jump around in different patterns with no long trends. The None strategy effectively
acts as a mild Value strategy taking profits from the winners and buying the depressed
issues. This can be an effective strategy for holding speculative issues long term. None
Strategy is is particularly useful when dealing with speculative stocks whose prices
jump around in different patterns with no long trends. The None strategy effectively
acts as a mild Value strategy taking profits from the winners and buying the depressed
issues. This can be an effective strategy for holding speculative issues long term.
Note how the Red line smoothes out the erratic movements producing returns
substantially greater than a true average.
|
 Momentum
Modeling Momentum
Modeling
When the rebalancing period has elapsed, assets are sold from the worst
performing issues until 25% of the total assets have been liquidated. The liquid assets
are then reinvested in the top 10% of all the issues. In the chart, all assets quickly
shift to the 30% holding.
Momentum strategy works well in bull
markets and decently in bear markets WHEN the list/family averaged includes
a diverse set of sector mutual funds like the SELECT or EXTRADED family. The
Cyan line starts at (30%+20%+10% ) / 3= 20% rate of return, but curves up to the 30% rate as
assets are transferred quarterly to the 30% line. See Momentum trading examples at, Sector Mutual Fund
Trading, and
Morningstar style trading.
|
 Value Modeling Value Modeling
When the rebalancing period has elapsed, assets are taken from the best
performing issues until 25% of the total assets have been liquidated. The liquid assets
are then reinvested in the bottom 10% of all issues In this case reinvested in a
single issue, the red 10% line.
The Cyan AVG line starts out at the 20% return /year average, but
curves down
matching 10% line's gains as assets transferred at the end of each year to the worst performing
red 10% line.
Value
strategy usually reduces volatility, but also reduces return.
Substantial caution MUST be used when using the Value model. A single bankrupt stock
dying a slow death can devastate a Value portfolio.
|
The FT4Web Modeling capability is a proof of concept.
Practical application requires choosing the periods to rank. They need
not be equal length periods. Choose issues from at the list top to buy and
from the bottom to sell.
NEVER follow a model's suggestions to hold a highly
nondiversified portfolio. Return and Sharpe models will show a spike in
late 1999 when the models become overweighted with technology. FastTrack's
FTAlpha Momentum Models overcomes this
overweighting.
A model's family should be varied regularly. Funds whose NCAlpha
is negative with respect to your portfolio's recent performance should be removed
from the family. Issues with a high NCAlpha should be added.
Keys: leverage, on the margin, margining , double beta, Select Momentum,
Sector Momentum, Momentum Model, Fidelity Momentum, ETF trading Range, ETF
Spread, Bid ask, Bid/Ask, underlaying index, ETF underlaying,
|
|